How the State Collects Money and Why it Matters
Download this tax guide (updated July 2023; 16 pages; pdf)
Link to the executive summary
Link to the Guide to New Mexico’s State Budget executive summary
Link to the full Guide to New Mexico’s State Budget
Link to An Advocate’s Guide to New Mexico’s Budget
Link to A Guide to Legislative Advocacy in New Mexico
Introduction
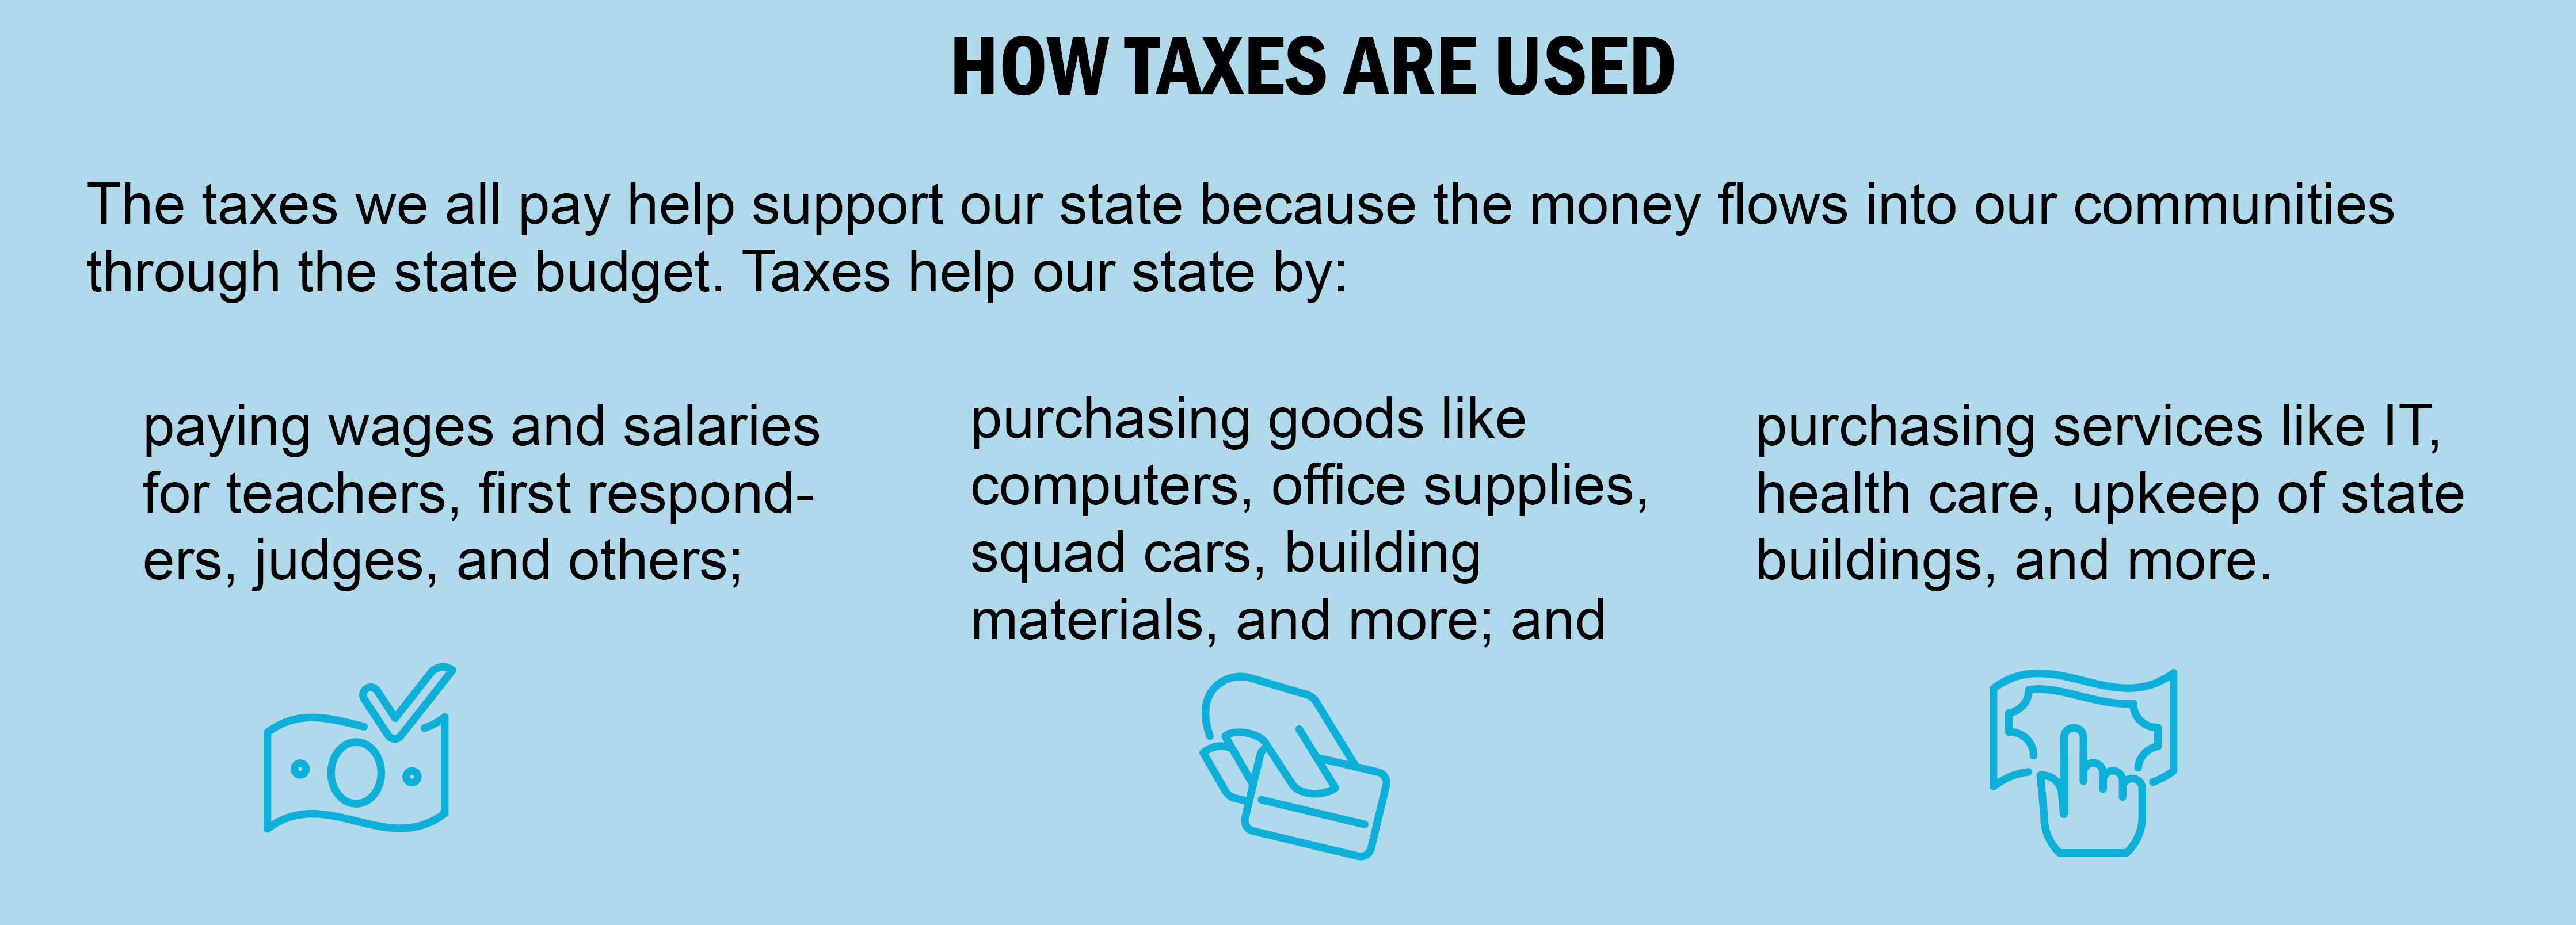
Almost every dollar that the state of New Mexico spends – whether to pay teacher salaries, purchase asphalt to build roads, or fill up the gas tank in a state trooper’s vehicle – is raised through tax collection. Elected officials decide how to spend tax revenue through the annual budgeting process. These lawmakers also determine how tax money is collected – how much we all pay in taxes, what we’re taxed on, and when. Although we must collect tax revenue in order to accomplish our collective goals, taxes have long had a bad rap. What’s more, tax systems are inherently complex. Do not despair! This guide seeks to bring the basics of the state’s tax system into focus for you.
We’ll start this guide with a brief look at why our state tax system is important. We’ll follow up with a quick overview of the various sources of state revenue (there’s more than one), then delve into the principals of a good tax system and what constitutes “fairness” in taxation. While this guide describes the basics of New Mexico’s tax system, two companion publications – A Guide to the New Mexico State Budget and An Advocate’s Guide to the New Mexico State Budget – explain how those taxes are spent. They look at the basics of the state’s general fund budget, the budget formation process, and how citizens can promote their priorities within that process.
Some Tips for Using this Guide
Acronyms
CIT – Corporate income tax
EITC – Earned Income Tax Credit
FIR – Fiscal impact report
FY – Fiscal year (July 1– June 30)
GRT – Gross receipts tax
LFC – Legislative Finance Committee
PIT – Personal income tax
TEB – Tax expenditure budget
TRD – Taxation and Revenue Department
WFTC – Working Families Tax Credit
Words that appear in boldface are defined in the Technical Terms and Tax Facts boxes. Acronyms used in this guide are written out in the box below.
Why Taxes Matter
Our state tax revenue is what allows us to accomplish things that benefit us collectively. This includes helping provide the programs, services, and infrastructure – such as education, public health and safety, and roads and bridges – that make our economy possible and that we all depend upon. If we think about our state budget as the blueprint for the New Mexico we wish to create, we can think of our taxes as the way we make those plans a reality. We use tax revenue to meet our current needs – such as educating our children and maintaining our highways – and to solve our problems – such as poverty, drug addiction, and crime. We also use our tax revenue to anticipate and prevent future problems that we know will affect the well-being of our state.
Just as our tax revenue allows us to prepare for the future, we also continue to rely on tax revenue that was spent in the past. For example, many of the roads, water lines, and schools that we use today are the result of investments we made with tax revenue in the past. In reverse, many of the investments we make today will still be benefitting New Mexicans in years to come. For example, the children we educated just a generation or two ago are the workforce of today just as the children we educate today will be the workforce of tomorrow.
In a more basic sense, our tax system is a statement of our values and priorities – how much revenue our state lawmakers think we should collect to provide for our common needs, and who pays how much of the cost. A tax code can spread the payments evenly among taxpayers or it can require some New Mexicans to pay more and allow others to pay less. When looking at New Mexico’s tax system it is clear that we prioritize corporations because we require them to pay very little in taxes even though the state provides the infrastructure they depend upon in order to do business. Similarly, our state and local tax systems combined require that those individuals who earn the most money pay a smaller share of their income in taxes than everyone else except those who earn the very least money.
Tax cuts tend to be popular, but they have their down side. Every time the government cuts taxes for one group of people or businesses, it either has to raise taxes elsewhere or it has to cut spending. Spending cuts can lead to more crowded classrooms, fewer judges, and roads that go unrepaired.
These decisions about our tax system are made by our state Legislature and Governor. These people, as elected representatives, work for us. So it only makes sense that they hear from us about our priorities, our values, and what kind of New Mexico we want to create. For more information about how to advocate for the policies that are important to you, please see A Guide to Legislative Advocacy in New Mexico.
How the State Collects Money
General Fund Revenue Sources
Technical Terms
Gross Receipts Taxes – Taxes collected on the gross receipts (total money taken in) of a business or service provider. It is usually passed along to the consumer.
Compensating Tax – A tax on goods that are bought out-of-state for use in New Mexico. Say, for example, you open a restaurant in New Mexico but purchase your chairs and tables in Texas. You must pay compensating tax on those purchases.
Excise Taxes – Taxes levied on specific goods, such as cigarettes, alcohol, and cars.
Income Taxes – Taxes paid on an individual’s personal income or a company’s profits.
Severance Taxes – Taxes paid on natural resources such as crude oil and natural gas, so named because these resources are ‘severed’ from the ground.
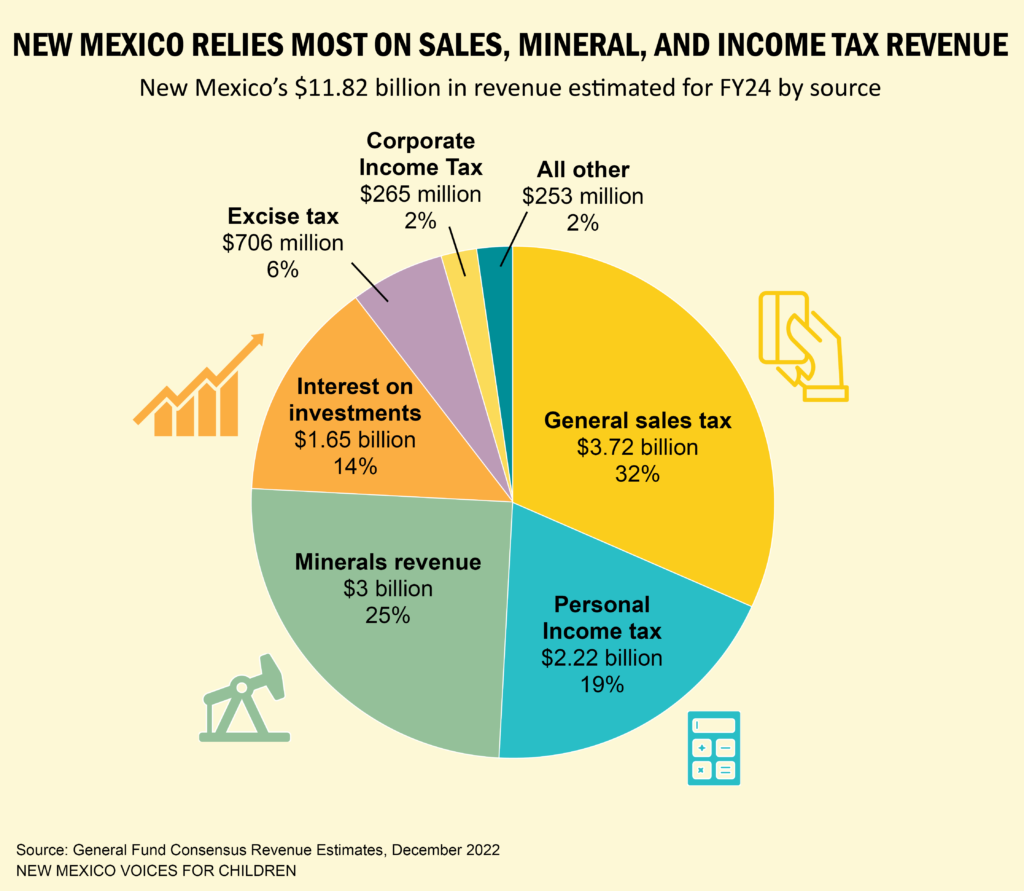
This guide focuses on revenues that are deposited in the state general fund, which is the state’s main pot of money for operating expenses. The revenue sources pie chart shows where the state gets its tax revenue, and how much is expected to be generated for fiscal year 2024 (FY24). The largest slice of the pie comes from general sales taxes. This includes gross receipts taxes (GRT) and compensating taxes. GRT is levied on most goods and services and is often passed along to the consumer. Because services constitute an increasing share of economic activity, while goods constitute a decreasing share, more states are beginning to tax services. Many cities and counties in New Mexico also collect GRT to pay for municipal services, so the rate you pay will vary depending on where you are in the state.
The next slice is excise taxes – these are taxes on the sales of goods such as tobacco, liquor, motor vehicles, and telecommunications services. People often suggest raising so-called “sin taxes” – taxes on alcohol and tobacco products – as a way to generate revenue, but as the pie chart shows, such taxes do not amount to a significant share of revenues.
The mineral revenues piece of the revenue pie includes severance taxes on crude oil, natural gas, coal, copper, and other hard minerals that are extracted from the ground, as well as rents and royalties from the sale or lease of mineral-producing land. The vast majority of these mineral revenues comes specifically from taxes collected on oil and natural gas extraction.
Tax Facts
The Difference Between the GRT and a Sales Tax
The GRT differs from a more traditional sales tax in a number of ways. In general, a sales tax is a tax levied by the government on the sale of products to customers. The business selling the product is simply the go-between – collecting the tax from the customer and passing it along to the state (or city or county). The GRT is a tax on the business’s total receipts – or the money it takes in. While it is generally passed along to the customer, it doesn’t have to be – but it still has to be paid to the government. Gross receipts are not the same as profits, which is the money the business makes from the transaction minus the deduction of allowable expenses.
Severance taxes tend to be “exported,” meaning they are largely paid by people and companies in other states – mainly consumers and shareholders, as well as oil and natural gas producers, most of which are businesses owned by out-of-state companies. This revenue is based on the value of production (e.g., the price of a barrel of oil), so changes in the market prices of these commodities can have a significant effect on the amount of revenue collected by the state. Based on December 2022 estimates for direct oil and gas revenue, a dollar increase in the price per barrel of oil translates into an additional $48.4 million for the general fund.
Aside from severance taxes, oil and gas extraction also brings in significant revenue through the GRT, making the industry’s total revenue contribution worth about a third of the whole.
Income taxes, the second largest category, are made up personal income taxes (PIT) and corporate income taxes (CIT). Corporate income taxes are levied on a corporation’s net profits, which can fluctuate widely from year to year. Also, the Legislature has enacted many tax breaks and significantly lowered the top CIT rates beginning in 2014.
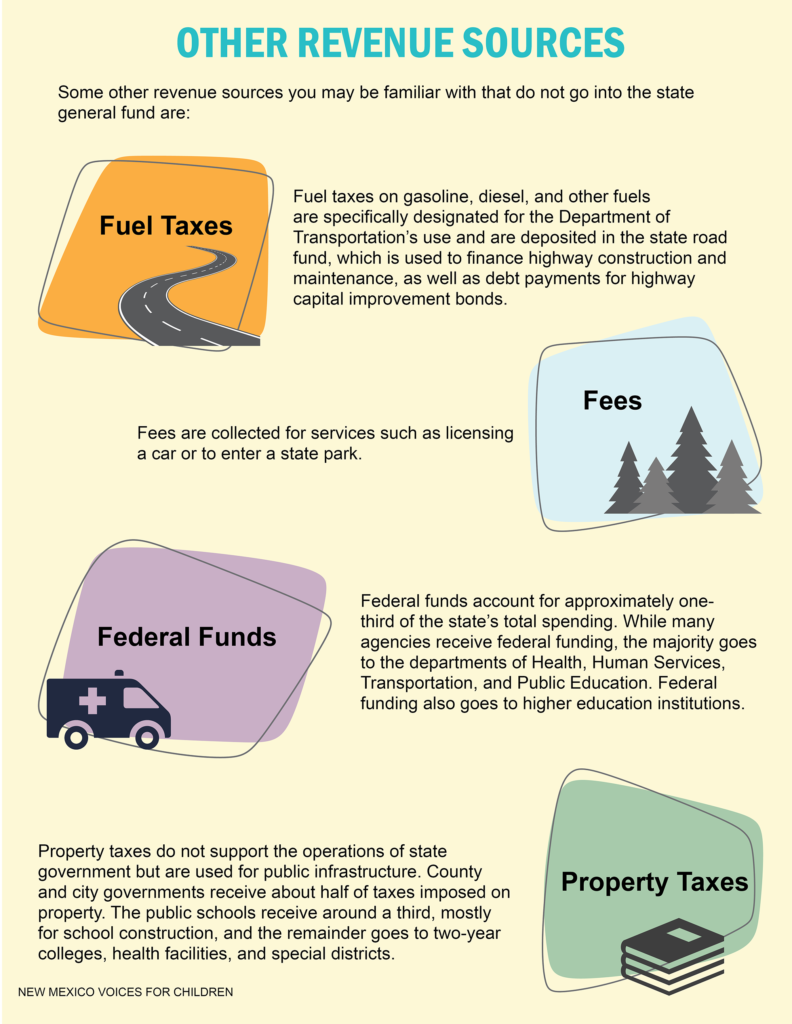
The final two categories – “interest on investments” and “all other” – include some non-tax revenues. Interest revenue is primarily income derived from investing permanent fund revenue in the stock and bond markets. New Mexico derives an unusually large share of revenue from investments, but this revenue also rises and falls with the stock market. The “all other” category includes gaming revenue from tribal casinos as well as the fees paid on things like registering your car or visiting a state park or museum.
 Spending Through the Tax Code
The state spends money both directly and indirectly. Direct spending takes the form of annual budgeting for programs and services such as education, public safety, and health care. Direct state spending is covered in the companion publication A Guide to the New Mexico State Budget. The state also spends money indirectly by choosing to forego collecting certain tax revenues. While direct spending is done through the budgeting process, indirect spending is handled by changing the tax code.
Over the years, the Legislature has enacted many tax breaks, which are called tax expenditures. Many tax expenditures are enacted as a form of economic development because they provide a subsidy or incentive for specific businesses. Tax credits for solar panels, which help people afford the cost of having them installed on their homes, is an example of this. Other expenditures are intended to help groups of people. The Working Families Tax Credit (WFTC), which helps low-income working families, is one example.
Technical Terms
Tax Expenditure – A way the state spends money indirectly by foregoing the collection of revenue through tax exemptions, deductions, and credits.
Tax Expenditure Budget – An accounting (usually annually) of the cumulative cost of all tax expenditures. Such a report may also determine whether the tax expenditure had the intended economic effect.
Tax Exemptions (as applied to the gross receipts tax) – Goods and services that are not taxed. For example, the state does not collect taxes on the food we buy to eat at home because it is exempt from the GRT.
Tax Deductions (as applied to the gross receipts tax) – Expenses that can be subtracted from a business’s tax return. For example, if a business rents construction equipment, the state does not collect taxes on that rental because the business has deducted the cost from their tax return.
Cuts in taxes almost always result in the state collecting less revenue. Lower revenue means the state will either have to cut its direct spending or it will have to raise other taxes or fees to make up the difference. Before any legislation to enact a tax break is passed, however, the state tries to estimate how much it will cost. These estimates are contained in a fiscal impact report (FIR) prepared by the Legislative Finance Committee (LFC) staff.
Once a tax break is enacted, it is a good idea to track how much it is costing the state, and whether it is having the desired outcome. This regular accounting is called a tax expenditure budget (TEB), and it should include reporting requirements and sunset dates for all tax expenditures. Unfortunately, for many years the state did not track the cost and benefits of the many tax breaks that had been enacted.
For several years, the state’s Taxation and Revenue Department (TRD) issued a TEB under executive order of the governor. The annual accounting is now required in state statute, however. While that is an improvement, it still lacks a robust evaluation of the effectiveness of tax breaks.
Spending on the budget side is analyzed every year and lawmakers expect to be given information on how the money was spent and whether the spending produced the desired outcomes. But once an expenditure is written into the tax code it is less likely to be revisited and we often never learn if it worked as intended.
Who Pays?
A state tax system can either be regressive, proportional or progressive.
Technical Terms
Regressive Taxes – Those with lower incomes pay a higher percentage of their income in tax than do those with higher incomes.
Proportional Taxes – Everyone pays the same percentage of their income in tax.
Progressive Taxes – Those with lower incomes pay a smaller percentage of their income in tax than do those with higher incomes.
Sales and excise taxes tend to be regressive, meaning those with the lowest incomes pay the highest share of their income in these taxes. That is because the lower a person’s income, the higher the share that must be spent on day-to-day necessities – such as gas, utilities, and non-food groceries – most of which are taxed. Families with lower incomes spend a greater proportion of their income on sales taxes than do upper-income households, which can save or invest some of their earnings because they do not need to spend it all to make ends meet.
A proportional system in one in which everyone pays the same percentage of their income in taxes. This may sound like the most equitable option, but it does not take into account one’s ability to pay or minimize taxes on low-income households. For example, imagine a proportional tax system in which everyone paid 10% of their income in taxes. Consider a household living on just $20,000 a year – that’s less than half the state’s median income. A 10% tax rate means a loss of $2,000 – which is a lot of money for a family in that situation. At that income level, 10% equals a month’s rent, utilities, and groceries. For the household earning $200,000, a 10% tax rate leaves them with $180,000 – a healthy, six-figure income that’s four times the median household income in New Mexico. With an income of $200,000, a 10% tax rate isn’t going to lead to skipping meals or medications in order to make the rent.
Income taxes are generally progressive, meaning those who earn the least pay the lowest rates, with rates increasing as income increases. The federal income tax was designed this way to help make up for the fact that state and local taxes tend to be regressive.
Most people agree that low-income households shouldn’t pay a higher percentage of their income in taxes than the rich. However, the truth is that those with the lowest incomes do pay a much higher share of their income in taxes than the rich in New Mexico.
When we look at taxes as a share of income, the ideas of regressivity and progressivity become clearer. The “New Mexico’s State and Local Tax System in Detail” bar chart illustrates what percentage of their income non-elderly New Mexicans pay in taxes. The chart is organized by income levels, from the lowest 20% to the highest 1%, and by type of taxes paid, in order to show how the impact of taxes varies depending on one’s income.
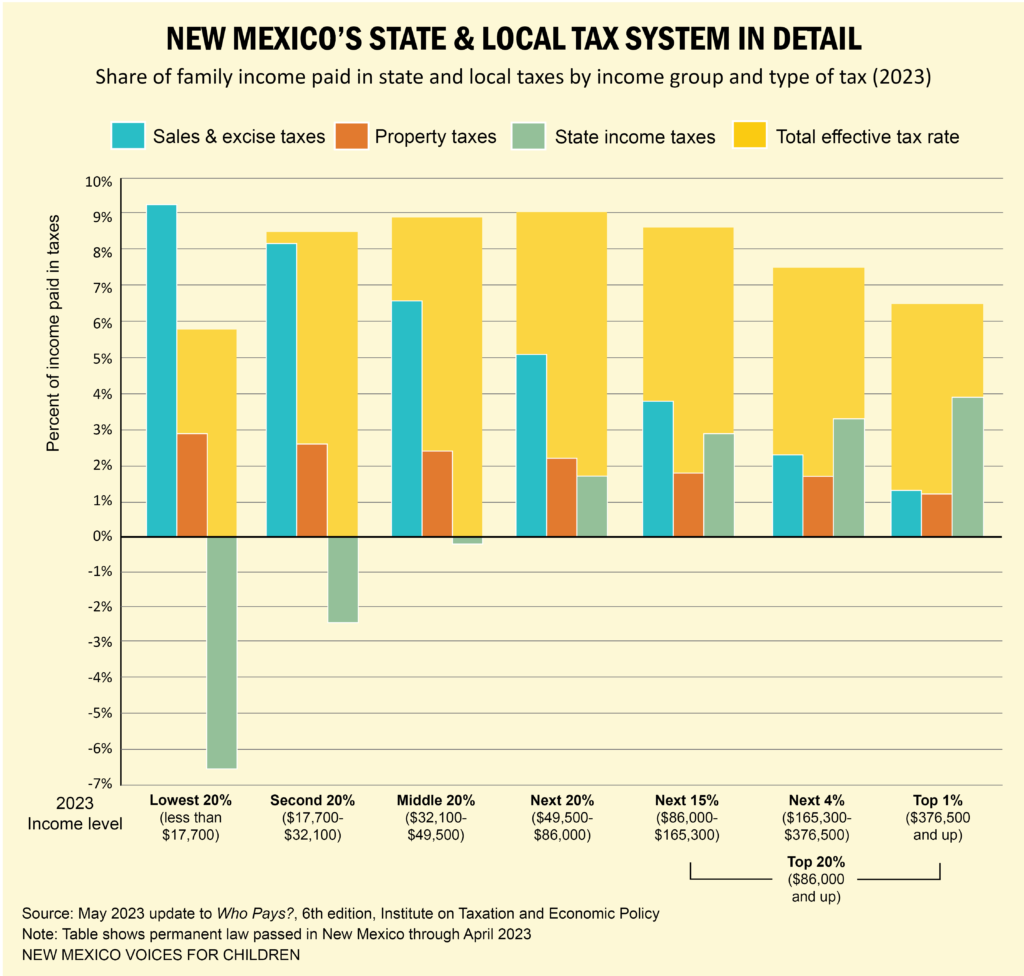 The idea of regressivity becomes clear when you look at the blue bars – sales and excise taxes. These taxes eat up a larger share of the income for those in the bottom brackets. The same is true for property taxes (orange bars), which are also regressive. People often assume that property taxes are only paid by homeowners, but the cost of property taxes – along with the costs of upkeep, insurance, and the interest paid on a mortgage – is generally passed along to renters. (In contrast, the tax deductions for some of these expenses that are paid by the renter go to the landowner, thereby decreasing their tax bill.)
State income taxes (green bars) are the only progressive part of the state and local tax systems. As the amount earned increases, the percentage paid to income taxes also increases. Several refundable income tax credits are available for many New Mexicans whose earnings put them in the lowest income brackets. That is why the green lines for the bottom 60% dip below the 0% line. For families who owe income taxes, the credits reduce their overall tax bill. For families who do not owe taxes, or if the tax credit amount is greater than what they owe in taxes, the credits refund money they’ve already spent (on, for example, child care).
The gold bars show the total share of income paid in state and local taxes – or the effective tax rate. On the lower end of the bar chart, the bars increase as income increases – meaning the overall system is progressive. But only to a point. The overall effective tax rate tops out at 9% in the fourth quintile and then the rates begin to decrease again. While this means those who have the highest incomes pay some of the lowest effective tax rates, they do not pay the very lowest tax rate – that falls to those with the very lowest incomes.
While this is not a perfectly progressive tax system, it is significantly better than it once was. The “New Mexico’s State and Local Tax System: Then and Now” bar chart shows how the tax system was in 2018 before several tax credits and reforms were enacted. These include the Child Tax Credit, which was enacted in 2022 and then increased for families earning low and moderate incomes in 2023. The light yellow bars with dashed outlines show what the overall effective tax rates were for groups in 2018. Then, those in the lowest 20% and 40% paid the highest effective tax rates – 10.6% and 10.7%, respectively. The rate for those in the lowest quintile has since fallen to 5.7% – or now the lowest rate of all – as shown by the gold bars.
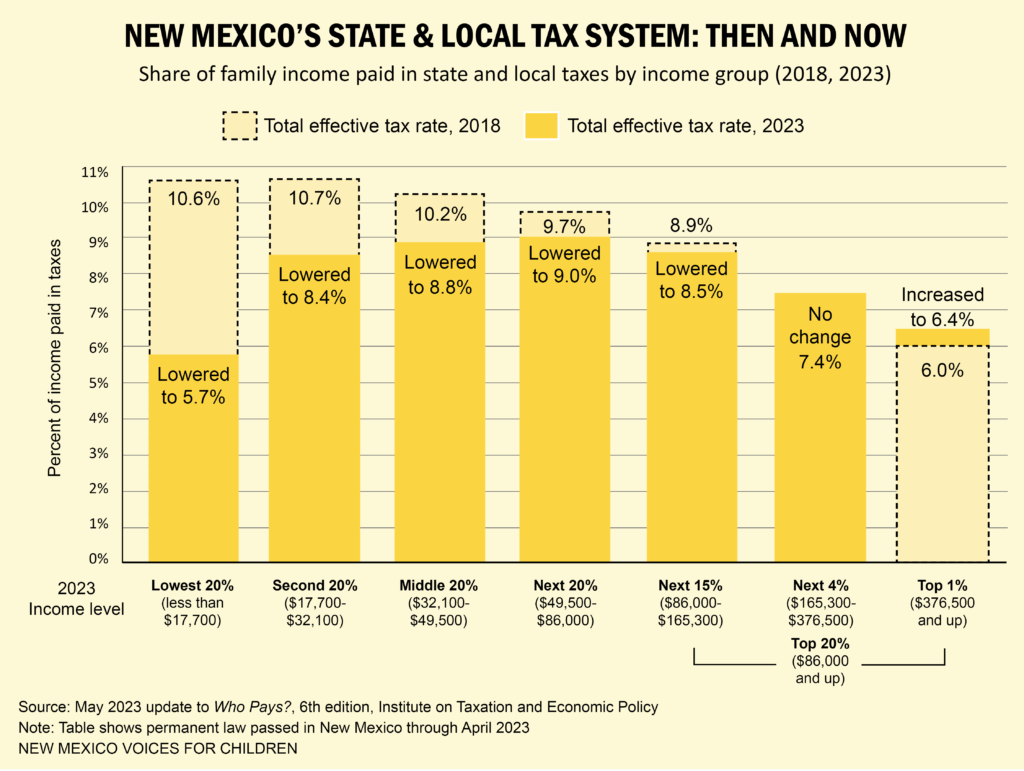
Still, the next-lowest rate – just 6.4% – is paid by those earning income in the top 1%. The top quintile as a whole still pays far too low a rate in taxes. With incomes starting at $86,000 – well above the state’s median income – this group can afford to pay considerably higher rates.
Not All Tax Codes Are Created Equal
The characteristics that should be built into a state’s tax code include:
- Accountability
- Adequacy
- Consistency
- Efficiency
- Equity
- Simplicity
- Stability
- Transparency
Accountability means that tax credits, exemptions, and deductions are easy to monitor and evaluate. Tax cuts are often enacted in the hopes that they will change behaviors – get companies to hire more employees, for example. If the state cannot determine if those goals are met, the tax system is not accountable.
Adequacy means that the tax system meets state spending needs, provides enough revenue to build strong communities, and provides robust opportunities for children and families to thrive. Additionally, adequacy means that state spending keeps pace with inflation and population growth.
Consistency is achieved when tax revenues grow at the same rate as state personal income. Gross receipts and income taxes are the most consistent because they closely follow population growth. This is important because population growth impacts the need for state services.
Efficiency means that the tax code has a broad enough base to avoid excess reliance on one tax. Most states rely on three tax sources: income, sales, and property taxes. New Mexico also collects severance taxes, so the state has four main sources of revenue, giving it a broader base.
Equity in a tax system means two things. Horizontal equity means that similarly situated taxpayers should be treated similarly. For example, families of the same sizes and with the same incomes should expect to pay the same amount in taxes. Vertical equity means that the amount a taxpayer pays in taxes should be determined by their ability to pay. For example, a tax rate that is lower for people with lower incomes is more vertically equitable. Personal income taxes normally incorporate this ability-to-pay principle – and are thus more progressive – because they are graduated according to income, adjust for family size, allow some deductions and credits for family expenses like child and health care, and can include refundable tax credits for low- and middle-income families.
Simplicity is achieved when the effort that goes into collection is minimal and the tax code is easily understood. Every time the state enacts a tax exemption, deduction or credit, the system loses simplicity, making it more difficult to administer.
A tax system has Stability when it relies more on predictable revenue sources than on sources that wildly fluctuate. Personal income taxes are stable because they follow personal income growth. Severance taxes are less stable because they are based on the current prices of oil and natural gas, which are set at the global level.
Transparency is what makes accountability possible. A tax system is transparent when citizens have enough information about the tax code to hold government accountable.
New Mexico’s Tax Low-Lights
In general, when viewed through the lens of these principles, New Mexico’s tax system needs improvement. Given the myriad of tax credits, exemptions and deductions to the state’s tax code, it would be hard to argue that it is accountable. The GRT, in particular, is often referred to as Swiss cheese, given the hundreds of exceptions that have been passed – and more are enacted every year.
These exceptions to the GRT, along with corporate and personal income tax cuts enacted within the past 20 years, have reduced important streams of revenue. Due to these giveaways, which mostly benefited the biggest corporations and wealthiest earners, the state was left without adequate funding for crucial programs and services when revenues plummeted during the recession. Over the following years, many programs that support the health, education, and well-being of New Mexico’s children were cut or severely underfunded as a result. The recent boom in oil and gas production has changed that – at least for the time being. Placing too much reliance on these industries is problematic for other reasons (see stability).
New Mexico’s tax code can be called consistent because sales and personal income taxes are the make up the two largest shares of the state’s revenue pie. However, the state’s over-reliance on revenues from the oil and gas industry, which are volatile and susceptible to external economic shocks, keeps the tax system from being efficient.
As we have seen, the issue of equity is of major concern, with our high reliance on the gross receipts tax being the main problem because those on the lowest end of the income scale have to spend the largest share of their income on the day-to-day necessities that are taxed (except for groceries). Our refundable tax credits help with equity, but cuts made to the personal income tax rates for those in the top income brackets nearly flattened the one area of the tax code that can be progressive. A more equitable system would require that a larger share of the tax responsibility be distributed to those with the greatest ability to pay. Besides making the tax system less equitable, every time a tax cut is enacted the tax code becomes less simple to understand and implement.
These tax breaks added to the state’s over-reliance on revenue from the oil and natural gas industries. When oil and gas prices fall, the state takes a big hit. This unpredictability makes the tax code less stable. To make the tax system more stable and efficient, New Mexico must diversify its revenue sources and become less dependent on the oil and gas industry. Stabilizing revenue streams would also help improve adequacy.
If our tax code was more transparent, lawmakers and taxpayers alike would be able to hold it more accountable. The state has taken steps to improve transparency by issuing an annual tax expenditure budget. Unfortunately, it lacks much of the kind of analysis that would make it useful for determining where our tax code needs improvement.
How We Got Here and Where We’re Headed
In contrast to how the state’s revenue is spent – which relies on a fairly regimented budgeting process that uses the current state budget as a starting point – forming the tax code seems ad hoc, with new policies enacted every year. Some of these policies will bring in more revenue and some of them will mean the state foregoes revenue. Even with the best analysis, it can take years to determine whether a tax change has had the desired effect.
Still, tax policies are enacted with intention, so we can hardly claim that we have no idea how we got to where we are. That our tax system is overly reliant on revenue from oil and gas and makes those earning some of the lowest incomes pay some of the highest rates can come as no surprise to anyone who’s been following tax policy over the last 40 years.
The Reagan Administration introduced the nation to the term “trickle-down economics,” which led to big tax cuts for those at the top of the income scale. The rest of us got promises about how those tax cuts would impact the economy – promises that turned out to be quite empty. While tax cuts for the so-called “job creators” can spur some job growth, they have not been proven to pay for themselves.[i] Instead, the trickle-down economic experiment has led to a bigger national debt and the concentration of wealth into fewer and fewer hands. The rich got richer, while the rest of us saw our wages stagnate. States that followed suit – New Mexico among them – had similar results.
To add to this debacle, some large corporations have used this tax-cut frenzy to their advantage by pitting states against each other to get the biggest tax giveaway to expand their business to new locations. The massive sweetheart deals that corporations have been able to extract have resulted in a “race to the bottom,” with states trying to out-cut their neighbors. This has resulted in significant revenue losses for states and localities across the nation with nothing to show for it, and New Mexico is no exception. And while few companies would turn down a tax incentive, research shows that business owners weigh a very broad range of factors when considering new business locations. Chief among these are factors associated with the quality of living – such as the quality of the public education system and the local workforce, and proximity to highway, rail, and airline routes. Most of these quality-of-life enhancers are only feasible because they’re funded with public money – the very same tax revenue that these corporations demand they be excused from paying. Many states and municipalities that have offered generous tax deals to lure new business development have found that it was more expensive than it was worth – particularly if the new factory or headquarters ended up leaving.
When tax cuts result in spending cuts, both public- and private-sector jobs are lost. Cities and states not only cut back on employees, they also cut back on contracts with the private businesses, vendors, and non-profits that provide services. The jobs lost can range from teachers and technical advisors to health care providers. In short, a million dollars spent providing education or health care creates far more jobs than a million dollars sent back to shareholders or high-income consumers in the form of tax cuts. Leading economists say that cutting public-sector jobs in order to pay for private-sector tax breaks does more harm to the economy than good.[ii]
New Mexico’s Race to the Bottom
In the last two decades, New Mexico has cut personal and corporate taxes by billions of dollars in an attempt to lure companies to the state. Chief among these were personal income tax cuts enacted in 2003. This legislation cut the PIT rate for the top income earners by almost half – from 8.2% to 4.9%. New Mexicans earning the median income ($29,001–$45,000) received a small tax cut. Those earning the least – the bottom 40% of tax filers – received no benefit at all.
This made state income taxes considerably less progressive. The tax rate climbed rapidly in the lower-income brackets ($0 to $16,000 for individuals), then became flat – meaning an individual earning $20,000 paid the same top effective tax rate as someone with $2 million in income. To be truly progressive, tax rates should climb more rapidly in the highest income brackets.
Also in 2003, those receiving capital gains income were given an additional big break. Capital gains is income realized when something of value – stocks, bonds, real estate, etc. – is sold at a profit. Because it does not come from wages or salaries, capital gains is called “unearned income” by economists. This legislation allowed those with capital gains to deduct half of that income from their state taxes. Since the vast majority of capital gains income (88%) goes to those few filers at the top of the income scale (13%), the majority of the benefit of this deduction goes to those who don’t need a tax break. There is no evidence that the capital gains deduction promotes economic growth or fosters investment, meaning it is just a give-away for those at the top.
In 2013, without a fiscal impact report (FIR) and with very little debate, the Legislature passed an omnibus tax bill. Two of the most expensive provisions in the omnibus bill were changes to the state’s corporate income tax. The bill reduced the overall CIT rate and it also essentially eliminated CIT for the manufacturers operating in the state. Like the PIT cuts before it, the public was told that the 2013 bill would encourage job growth. There is no evidence that these tax cuts produced jobs.
Technical Terms
Fiscal Year – The revenue and budget year for the state. New Mexico’s fiscal year starts on July 1 and ends the following June 30. The fiscal year is named for the calendar year in which the fiscal year ends. For example, fiscal year 2020 (which began July 1, 2019) ends on June 30, 2020. Fiscal year 2020 is abbreviated as FY20.
Omnibus Bill – A bill consisting of many different smaller bills.
In addition to PIT and CIT cuts, year after year many groups have requested – and received – exemptions from the GRT. These handouts continually carve away at our GRT base and are often unproven and unnecessary when it comes to attracting business. When well-connected companies and groups no longer have to pay the GRT, the rate has to be increased on everyone else to keep revenues stable. These increases fall especially hard on lower-income communities, as the GRT is one of the most regressive parts of our tax code. In Española, for example, the GRT rate is one of the highest in the state at 8.9%, up from 7.25% just 15 years ago. Narrowing the base also makes us more reliant on volatile revenue from the oil and gas industry. When oil and gas go boom and bust, so do mineral extraction revenues, making it hard to reliably provide the programs and services that benefit all New Mexicans, like a quality public education system. The majority of legislators agree that the GRT rate is too high, and that these continual giveaways need to be seriously evaluated. If these tax breaks are not having their intended effect, they should be repealed so we can broaden the base and lower the rate for all New Mexicans.
All of these tax cuts made the state more reliant on volatile severance taxes. When oil and natural gas prices fell sharply in early 2016, the state was unable to bring in enough revenue to cover the programs and services that had already been budgeted – even though many of them were still being funded at lower levels than before the recession hit in 2008. The Legislature had to meet in a special session in October 2016 to make sharp spending cuts to both the FY16 and FY17 budgets. As revenue collections continued to lag, more cuts had to be made to the FY17 budget during the 2017 regular legislative session. While cutting spending isn’t terribly popular, many lawmakers find that they get less flack for that than for raising taxes. Once we’ve fallen off the trickle-down cliff, it’s difficult to climb back up.
Moving in the Right Direction
Tax Facts
Taxes And Inequity
A tax code that is more favorable to those with the most money is also one that only serves to increase the economic divide that persists along racial and ethnic lines. Due to centuries of racist policies, much more wealth and income is in the hands of those who are white, while Americans of color are far more likely to live in poverty and face barriers to financial success. New Mexico is no different. Our state and local tax systems favor those who earn the highest incomes, meaning it favors whites over New Mexicans of color. In a state where non-Hispanic whites are not the largest racial group, but have the most economic agency, it doesn’t make sense that we don’t do more to ensure that New Mexicans of color have every opportunity to succeed.
Since 2019, legislation has been enacted that makes New Mexico’s tax code more stable and fairer for those who earn low incomes. Changes included a new higher tax rate for those at the very top, a trimming down of the capital gains deduction, the creation of a Child Tax Credit, increases and expansion in the Working Families Tax Credit and the Low-Income Comprehensive Tax Rebate, and reductions in the GRT rate. As the table below shows, this has sent hundreds of millions back to New Mexico families while making our system more stable.
Conclusion
This guide was designed to invite New Mexicans into a deeper understanding of our state tax system – its purpose, how it forms a foundation for our economy, and what could be done to improve it. How we collect taxes says a great deal about our values and priorities – like whether or not we want a tax system that allows the families who earn the least to pay less because they have the fewest resources or if we want a system that allows those who earn the most to pay less even though they have the most resources.
Unfortunately, New Mexico doesn’t score well on most of the principles of a good tax system. Our growing reliance on volatile severance taxes has made our tax system – and the state services that depend upon it – less adequate, efficient, and stable. Tax cuts enacted in 2003 and 2013 only exacerbated these problems. Accountability and transparency are also weak points, and our tax system lacks real equity. Because our tax system favors those with the most money, it can’t help but favor whites over New Mexicans of color. In a state where people of color make up the majority of the population, it only makes sense that we restructure our tax system to ensure we all have opportunities to succeed.
Like the nation and many other states, New Mexico fell prey to faulty trickle-down economic theory. Rebuilding our tax system so that it better meets our needs will take time, but we seem to be headed in the right direction.
Endnotes
[i] “Tax Cuts: Myths and Realities,” Center on Budget and Policy Priorities, Washington, DC, revised May 9, 2008
[ii] “The Ultimate Burden Of The Tax Cuts: Once the Tax Cuts are Paid for, Low- and Middle-Income Households Likely To Be Net Losers, on Average,” William G. Gale, Peter R. Orszag, and Isaac Shapiro, Center on Budget and Policy Priorities, Washington, DC, 2004
Download this tax guide (updated July 2023; 16 pages; pdf)
Link to the executive summary (Jan. 2020)
Link to A Guide to New Mexico’s State Budget
Link to An Advocate’s Guide to New Mexico’s Budget
Link to A Guide to Legislative Advocacy in New Mexico