Link to the first report in this series, Making Sure All KIDS COUNT: Disparities Among New Mexico’s Children (Dec. 2010)
Download the first report in this series, Making Sure All KIDS COUNT: Disparities Among New Mexico’s Children (22 pages; pdf)
by Gerry Bradley, M.A.
This report is the second in a series documenting the disparities faced by children and families of color in New Mexico. This report will also describe policies that can effectively help all children and families—but especially those who face racial/ethnic disparities—and that could be implemented in this state. Our first paper in this series, Making Sure All KIDS COUNT: Disparities Among New Mexico’s Children, presented data documenting disparities faced by children of color in economic, health and educational outcomes. This paper will describe economic performance of the three largest racial/ethnic groups in New Mexico—Whites, Hispanics and Native Americans—as well as two much smaller racial groups—Blacks and Asians. It will also try to explain what is behind those different economic outcomes.
Setting the Context: Some Basic Language
New Mexico Voices for Children (NM Voices) collects and reports on the most comprehensive health, economic, educational and demographic data available to show how children and families are doing. These reliable data indicate where barriers exist that keep children and families from doing well and where gaps in well-being exist among different populations. We use these data to design and promote state and local policies, programs and opportunities that support all families, especially when they face disparities* and/or go through tough times.
Our state’s population is increasingly diverse, and people’s lives are shaped by various factors—like where they live, work, learn and play, what resources they have, the people around them, and their history and race or ethnicity.** Where one starts in life—in a poor or well-to-do family, in a safe or unsafe neighborhood, with or without access to health care and fine schools—tends to strongly affect the kind of life one will have. For these reasons, NM Voices is making a considered effort—in all its publications and work—to increase the amount and types of data broken down by income, race and ethnicity, and geography to better show where barriers to well-being exist for children. It is useful to break down data by such constructs as race and ethnicity so we can see how different groups of people compare on a measure, like economic status. This helps us to identify a disparity or inequity that is particularly pronounced in one or more groups. Identifying the disparity is just the first step—we must also determine what the causal factors are before we can consider how to address it. Decision-makers can then develop policies to better solve the underlying issue and promote equity for all.
NM Voices is most concerned with barriers to child well-being that are considered to be embedded racial inequities.*** An example of this was the design of the G.I. Bill after World War II. While this was a positive program that provided low-interest mortgages and down payment waivers for returning servicemen who wanted to buy homes for their families, it did not accord the same benefits to all racial groups. Restrictive lending practices at the time favoring Whites meant that more White families could purchase homes in new suburban neighborhoods than could Black, Hispanic, Native-American or Asian servicemen. Because of this inequitable access to the mortgage benefit, this meant that, over time, Whites were better able to begin building wealth. Today, White families continue to have greater wealth (resource) accumulation than do communities of color.
As much as possible, this special report presents racial and ethnic data using the U.S. Census Bureau classifications. Given this, races include: White, American Indian/Alaskan Native (we will use the term Native American), African American/Black (we will use the term Black), Asian, Native Hawaiian and other Pacific Islander, “two or more races,” and “other race alone.” The U.S. Census considers the Hispanic(or Latino) origin an “ethnicity,” not a race. Since people in each race group may also be Hispanic (such as a White-Hispanic or Black-Hispanic), this report presents most data by the following categories: Hispanic (any race), White (non-Hispanic), Black, Native American, and Asian.
Economic Well-Being and Race/Ethnicity
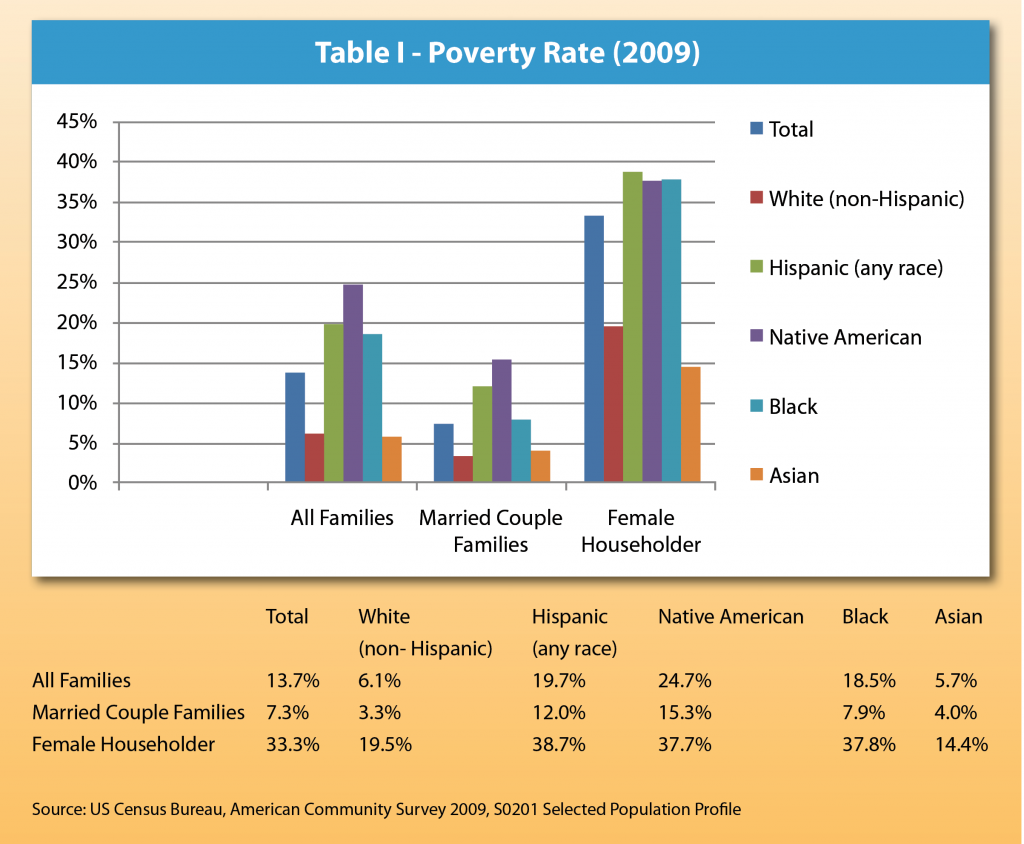
In New Mexico, as in much of the rest of the country, Hispanics, Native Americans, and Blacks lag behind Whites and Asians by several measures of economic success. As Table I indicates, Hispanics, Native Americans, and Blacks are more likely than Whites and Asians to live in poverty.
Three times as many Hispanic families and four times as many Native American families live in poverty as White families. Race and ethnicity are not the only issues at play here, as family structure is also an important indicator. Within each group, married couple families have much lower rates of poverty than do female householder families.
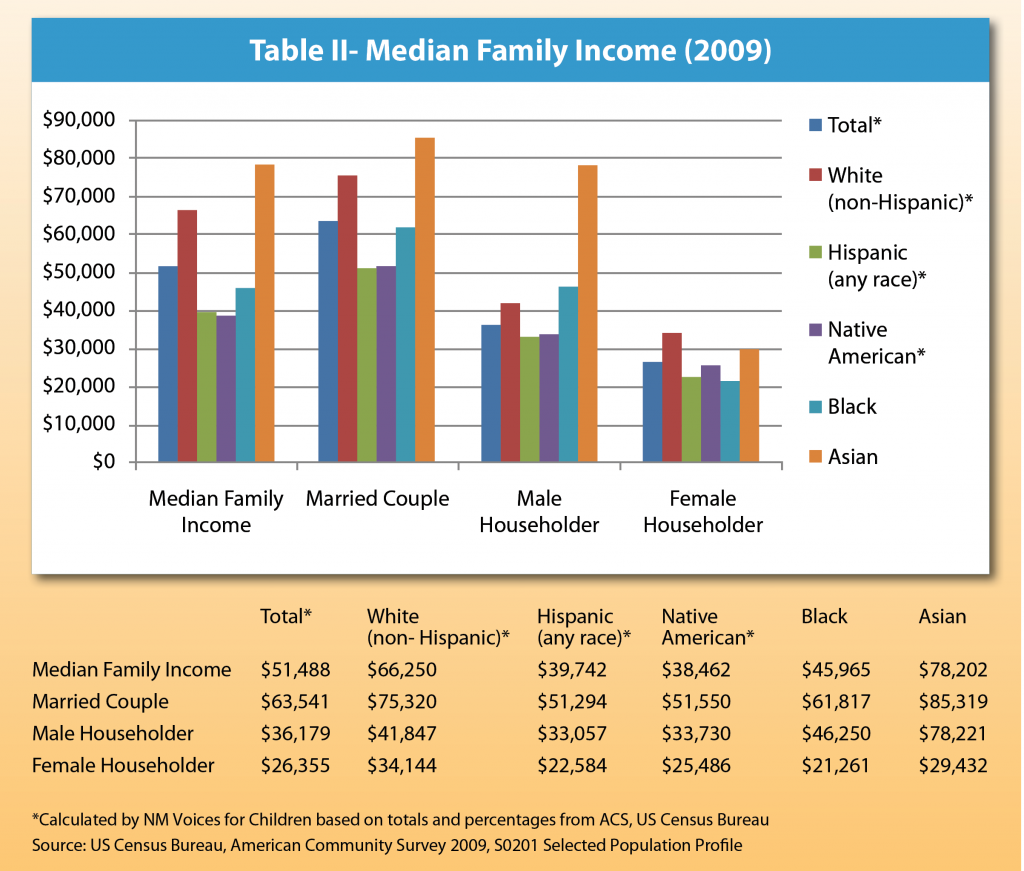
Table II shows that there is a substantial gap—about 30 percent—between the median family income of Whites compared to Hispanics and Native Americans. For all types of family structures, Whites and Asians have a higher median income than Hispanics, Native Americans, and Blacks. For all groups, however, families headed by a married couple have higher median income than single-parent families.
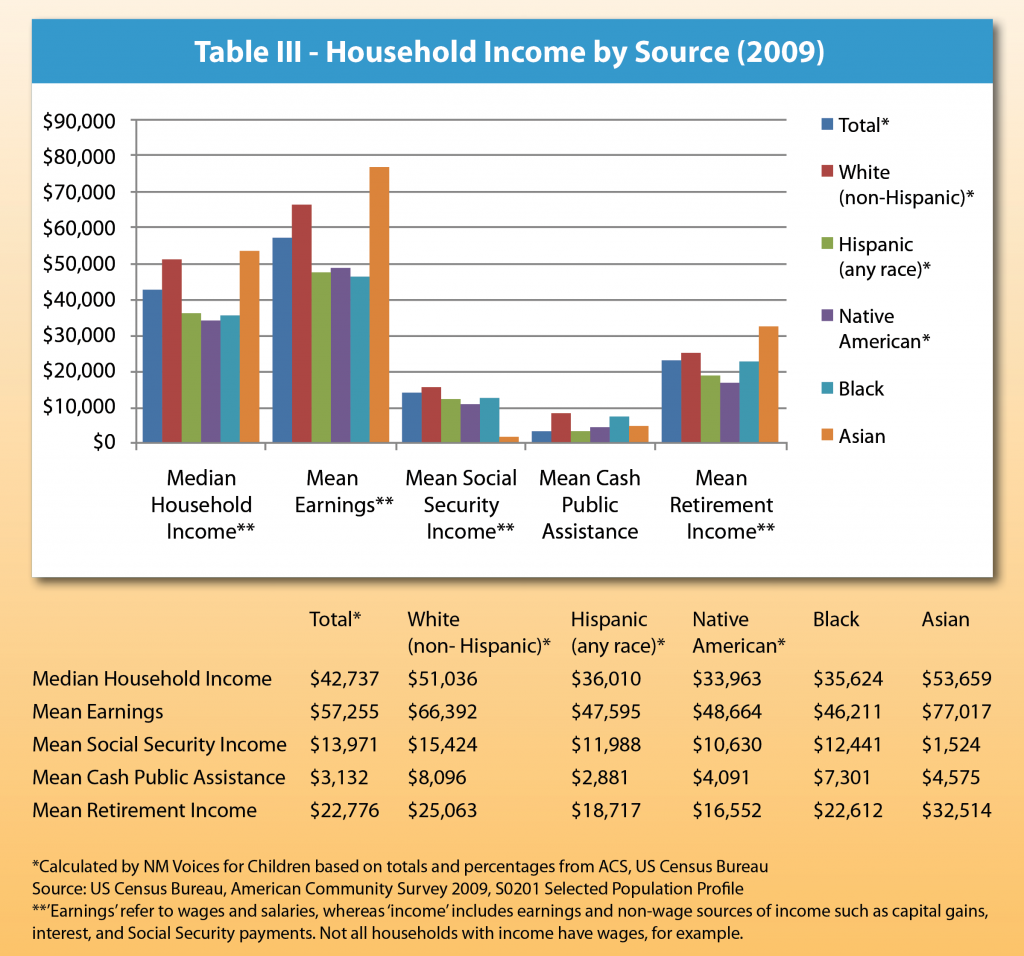
The source of a family’s income tells another story about that family’s economic well-being (see Table III). Clearly, householders in their working years fare better than those who depend on programs like Social Security because they are retired or for other reasons. While the median income gap between the White and the Hispanic and Native American populations is nearly 30 percent, the earnings gap is about 40 percent. The earnings gap shows that disparities likely exist within the labor market and the educational systems that prepare one to join the workforce. Gaps in mean Social Security income are somewhat smaller, although still significant, but mean retirement income is significantly higher for Asians and Whites than Hispanics and Native Americans. There may be several reasons for this. Asians and Whites may be more likely to have held jobs that paid a pension or contributed to a retirement account. They may also be more likely to have had enough disposable income that some could be placed in savings or invested in income-generating ventures.
One interesting note is that, even though Hispanics and Native Americans have lower mean incomes and higher rates of poverty than do Whites and Asians, their mean incomes from cash assistance are significantly lower than for Whites. The underlying cause for this disparity should be the source of significant study. Questions that should be answered include: are Hispanics and Native Americans less likely to apply for cash assistance? If so, what are the reasons? Are they more likely to be turned down for assistance or to receive smaller benefit sums? If so, how much of this may be at the discretion of those programs?
The demographics of each population, particularly regarding age, offer other pertinent factors, and shed some light on economic disparity. The age distributions of Whites, Hispanics, Native Americans, Black and Asians are starkly different, with Native Americans and Blacks skewing younger, and Whites skewing older. Some of the gaps seen in economic outcomes, such as family and household income and earnings, can be attributed to the youth of the Native American and Black populations.
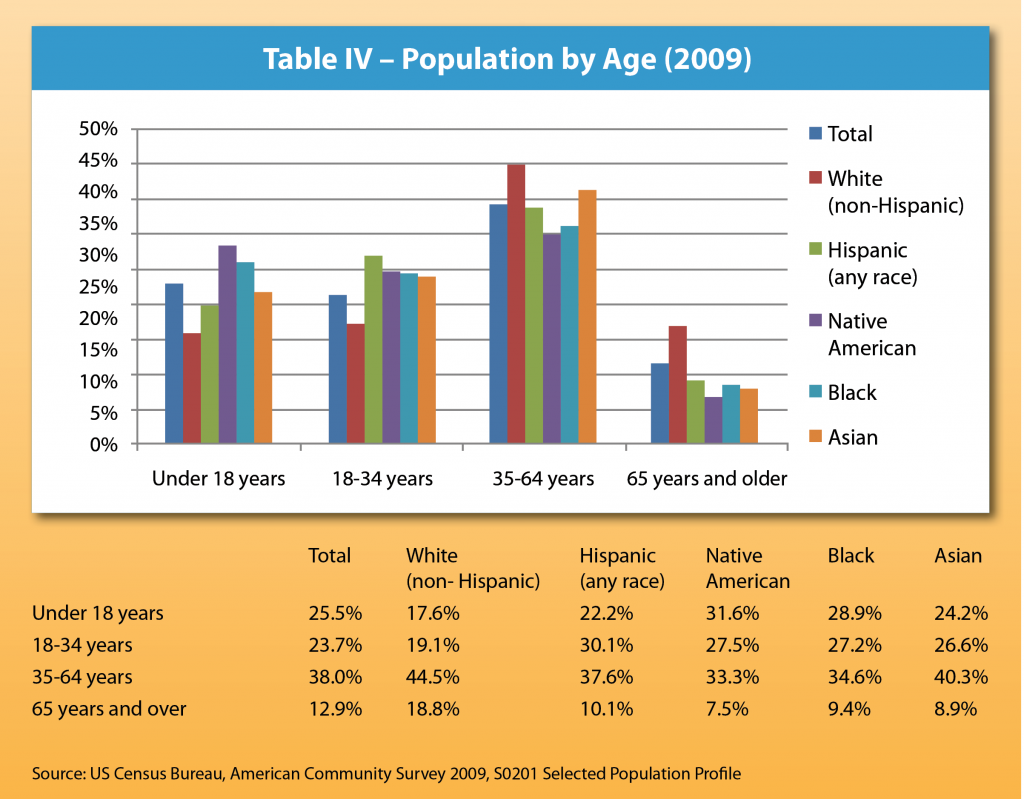
Table IV, Population by Age, shows that the age structure of Native Americans and Blacks is roughly similar, while that of Whites is markedly different. Almost a third of the Native American and Black populations, and about a quarter of the Hispanic and Asian populations, are under the age of 18, while less than a fifth of the White population is in that age group. This is relevant because, except for those in their late teens, youths in this age category do not contribute to the household income.
The Hispanic, Native American, and Black populations are also larger in the next age category, 18 to 34 years. While this age group has entered the workforce, they are still attempting to establish a secure footing in the labor market—entry-level jobs and many job changes are typical of this age group. Lower wages are expected for workers new to the labor market.
Those in the 35 to 64 age group are considered to be in their prime earning years. Job changing has slowed down and wages are rising with job stability and movement up the job ladder. About 44 percent of Whites and 40 percent of Asians are of prime working age, compared to only about a third of Native Americans and Blacks.
Finally, almost 20 percent of Whites are 65 and older, compared to 9 percent of Hispanics and 6 percent of Native Americans. At that age, people have largely completed their working life and have entered retirement. As shown in Table III, Asians and Whites also have higher retirement income than Hispanics and Native Americans. Higher retirement income generally reflects higher earnings during working years.
The concentration of Hispanics, Native Americans, and Blacks in the younger age groups put them at a disadvantage in economic outcomes. Whites and Asians are concentrated in the prime working age group, while Blacks and Native Americans are in the youngest age groups. While these differing age demographics most clearly reflect a shift in population growth, other factors may well be at play. For example, health disparities, most notably high diabetes rates for Native Americans and Hispanics, and high rates of heart disease for Blacks, may lead to premature mortality rates for those groups.
Just as birth rates may play a role in economic disparity, education levels play a role in birth rates—the higher the level of maternal education in a population, the lower the birth rate. Young women who have the means to go to college have more of an incentive to delay childbirth than do young women who do not believe a professional career path is within their reach. Women who put off having a family until they are through college and have had some years in the marketplace are less likely to have as large a family as women who didn’t have such options.
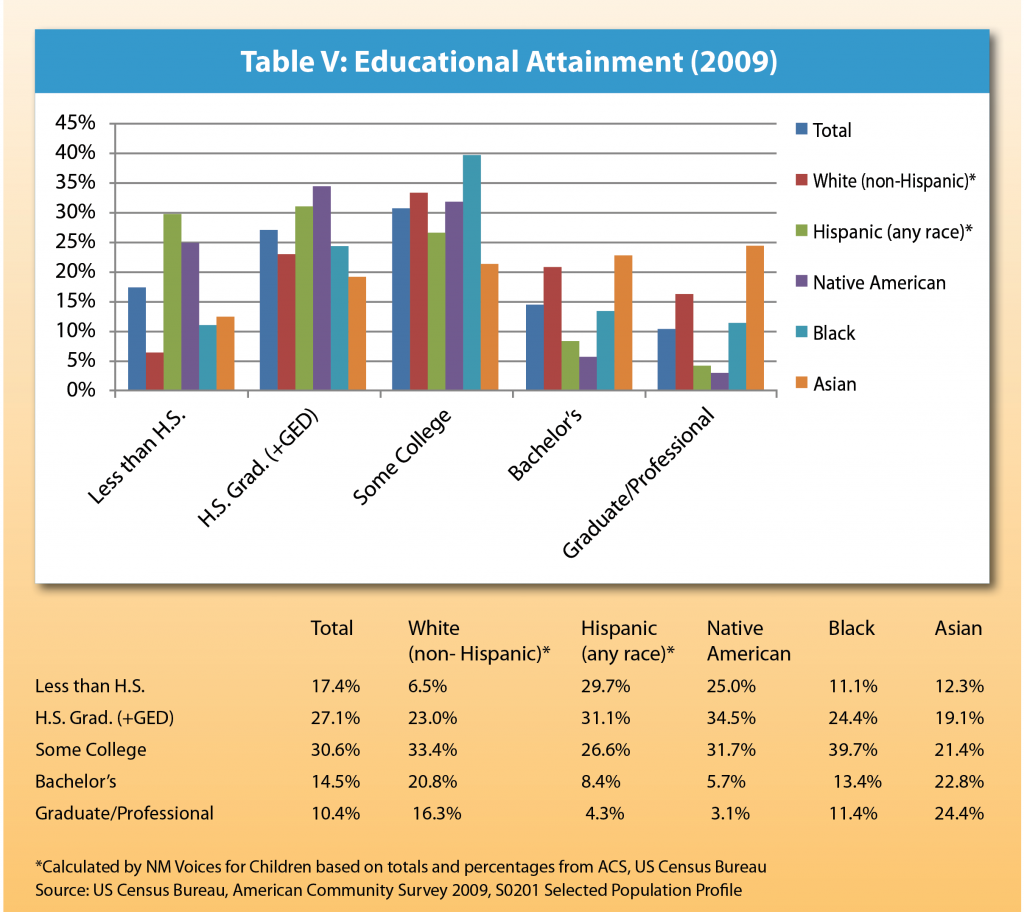
From Table V, it can be seen that there is a notable discrepancy between the educational level of Asians and Whites compared to Hispanics, Native Americans, and Blacks. Hispanics and Native Americans are far more likely to have ‘less than High School’ or ‘High School Graduate’ levels of education, and far less likely to have completed some college, or have a bachelor’s, graduate or professional degree. Whites, on the other hand, are more likely to have some college, a bachelor’s degree or a professional or graduate degree. Asians have the highest rates of graduate degrees. This educational discrepancy poses a challenge to narrowing the gap in economic outcomes amongst the groups. Level of education will determine labor market outcomes, as will be seen in the next chart and table.
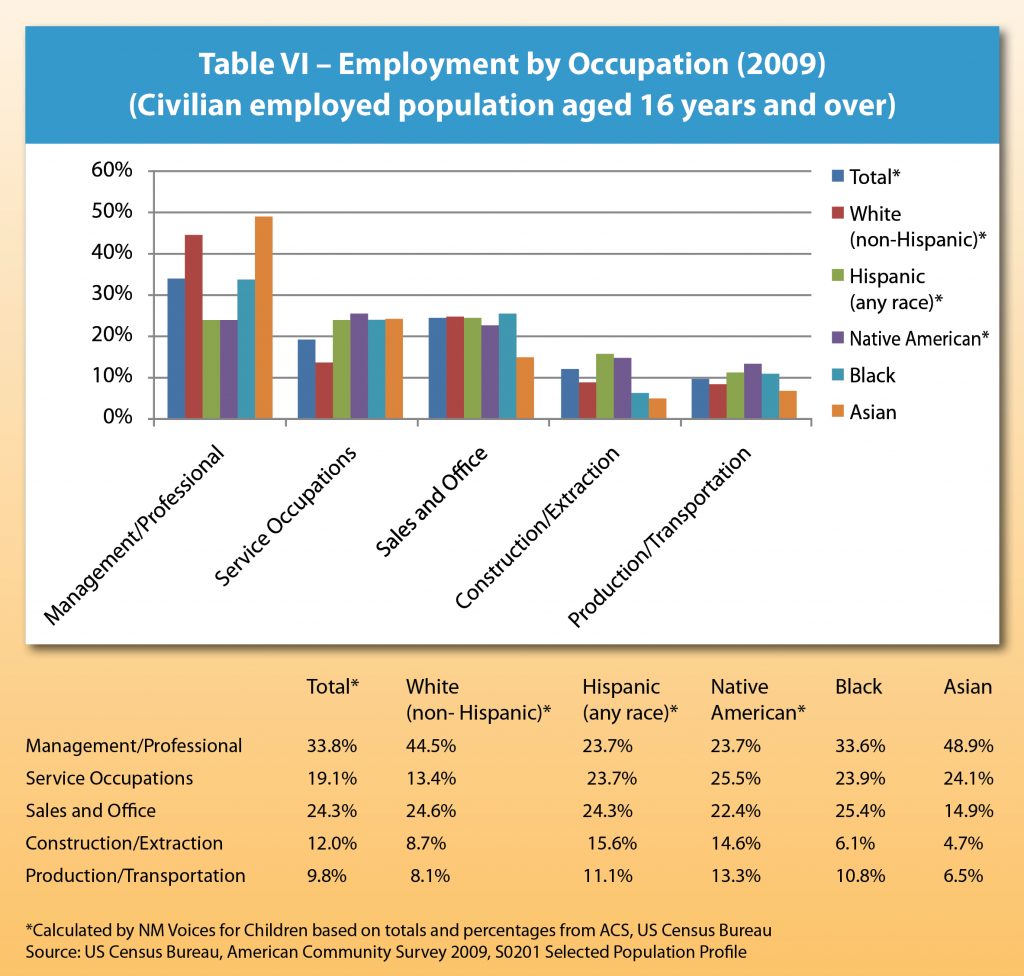
The distribution of the labor force by occupation is telling. Due in part to the youth and lower educational levels of the Hispanic, Native American and Black populations, these groups are over-represented in the service and production/transportation occupations, which tend to be higher-paying and offer better benefits. Hispanics and Native Americans are also over-represented in the construction/extraction industries. Asians and Whites, also due in part to greater age and higher education levels, are concentrated in management and professional occupations, which tend to be higher paying and offer better benefits. It is interesting that there is parity among Whites, Hispanics, Native-Americans, and Blacks in the sales and office category.
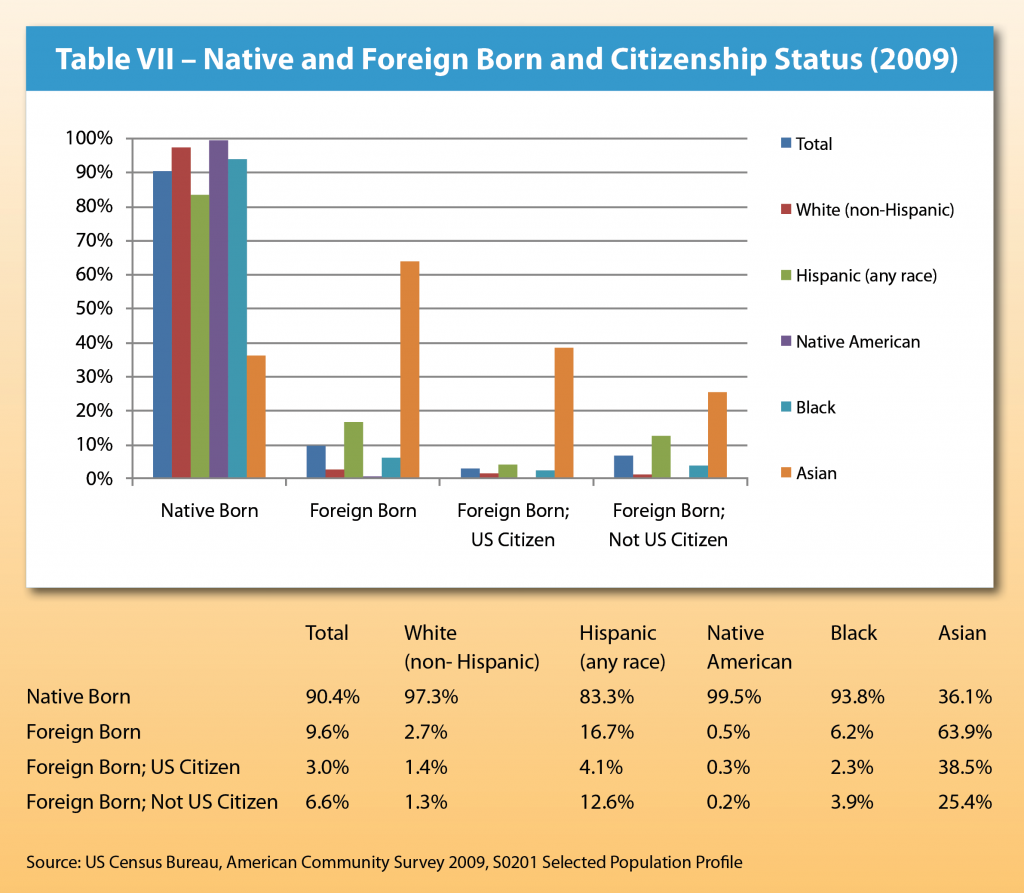
Citizenship status is another factor that can impact economic performance. As shown in Table VII, there is a wide discrepancy between Whites, Hispanics, and Asians in this indicator. While Whites are nearly 98 percent U.S. born, Hispanics are only 83 percent U.S. born. Also, foreign-born Hispanics are more likely not to be citizens than foreign-born Whites. Foreign-born residents who are not American citizens perform significantly worse than those who are native-born on most economic indicators. For instance, foreign-born New Mexico residents who are not citizens had a poverty rate of nearly 32 percent, while foreign-born New Mexicans who were U.S. citizens had a poverty rate of only 15.5 percent. This is a lower poverty rate than for the state as a whole, which is at 18 percent. The exception to this trend is seen in New Mexico’s Asian population. While they have, by far, the highest percentage of foreign-born residents—both who are citizens and who are not—they fare much better economically. Across all groups, foreign-born residents who become American citizens perform well by most economic indicators, including mean earnings and median household income.
Policy Recommendations
In conclusion, there is a substantial disparity in poverty rates, median income by household type, and household income by type of earnings between Whites and Asians on the one hand and Hispanics, Native Americans, and Blacks on the other. The disparity can be explained in part by the age distribution, educational attainment, and citizenship status of the five populations. In addition to these factors, many Native Americans contend with geographic isolation, which limits employment opportunities significantly.
One key to improving economic performance for Hispanics, Native Americans, and Blacks is access to high-quality comprehensive early childhood care and education programs, beginning with parental supports at birth such as voluntary parental coaching. Such programs are known to improve educational outcomes, including high school graduation and college attendance rates. They also are shown to lower the rates of teen pregnancy and youth incarceration—both of which impede later economic outcomes. Putting foreign-born Hispanics on a path to citizenship through comprehensive immigration reform will also help. To the extent that educational and employment outcomes are the result of segregation and discrimination, legal and legislative action will be needed.
Footnotes
*Disparity: A state of being different or unequal, as in age, rank, level or amount.
**Race and Ethnicity: Socially-constructed terms to describe differences (diversity) among people, and to give social and political meaning to the descriptions. Race, for example, is a socially constructed way to group people based on shared traits or physical appearance, like skin color, hair type, or eye shape. Ethnicity is used to describe people with something in common, like language, religion, ancestors, place, culture or values. Though being a part of a racial or ethnic group gives many people a sense of self and social identity, the concept of race has no real scientific basis. Biology shows that, genetically, humans are basically the same.
***Embedded racial inequities (also referred to as structural racism): Public policies, institutional practices and norms that—often unintentionally—make it possible for Whites to have more success than other racial/ethnic groups, thus reinforcing racial group inequities.
Download this report (June 2011; 14 pages; pdf)
Link to the first report in this series, Making Sure All KIDS COUNT: Disparities Among New Mexico’s Children (Dec. 2010)
Download the first report in this series, Making Sure All KIDS COUNT: Disparities Among New Mexico’s Children (Dec. 2010; 22 pages; pdf)
The Fiscal Policy Project, a program of New Mexico Voices for Children, is made possible by grants from the Annie E. Casey Foundation, the McCune Charitable Foundation, and the W.K. Kellogg Foundation.

