
 By Emily Wildau, MPP
Director of Policy
September 18, 2026
In order to make informed policy choices to strengthen and build the anti-poverty programs and services children deserve, we need to understand how their impact and effectiveness are measured. This is especially important in New Mexico, where significant investments and policy efforts have focused on reducing child poverty.
The U.S. Census Bureau released new 2025 data from the Current Population Survey on September 15, which includes a comparison of the most recent Official Poverty Measure (OPM) and the Supplemental Poverty Measure (SPM). The data primarily represent national poverty levels, but state-level data for 2023-2025 are also released in supplemental tables.
First, a quick refresher: What are the OPM and SPM measuring, and what do they tell us about child well-being? The OPM was developed in the 1960s to establish a poverty threshold based on a family’s pretax money income and a set of thresholds that vary by family composition. The OPM measures cash income and does not account for noncash benefits or tax credits. While poverty measures can inform eligibility policies, programs such as SNAP, Medicaid and WIC have their own eligibility rules.The OPM poverty threshold informs eligibility policies, with the eligibility rules for SNAP, Medicaid, and WIC.
The SPM, first published in 2011, was developed to address some of the limitations of the OPM. It provides a more comprehensive measure of economic well-being by accounting for government benefits and tax credits, as well as necessary expenses such as taxes, work expenses, child care and medical expenses. Its thresholds are based on spending on basic necessities and account for geographic differences in housing costs.
For the overall population, the poverty rate as seen in the SPM always has shown that more people are in poverty than captured by the OPM – except when pandemic-era programs that have now expired lifted record numbers of people out of poverty, including children.
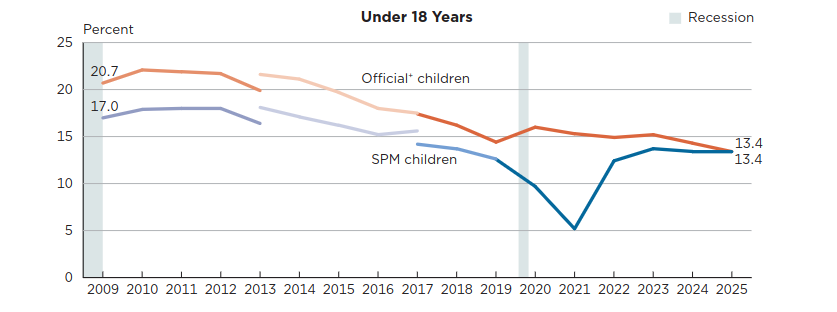
These measures tell two different stories about child poverty, but taken together, they show that poverty is shaped by policy choices. Over the past 15 years, the child poverty rate measured by the OPM has declined modestly. However, the OPM has consistently reported a higher child poverty rate than the SPM (see Figure 1). This difference suggests that policies have helped lift more children out of poverty when poverty is measured using the SPM than when it is measured using the OPM.
Figure 1: For the First Time the SPM and OPM Show the Same Rate of Child Poverty
Source: “Poverty in the United States: 2025,” U.S. Census Bureau, September 2026.
But in 2025, for the first time, the child poverty rate according to both the OPM and SPM was equal, at 13.4%. This indicates an erosion in policies that have historically meant fewer children in poverty nationwide when accounting for government non-cash programs and tax credits.
When we look at New Mexico’s three-year average OPM and SPM rates of child poverty, we see a much different story. By the OPM, New Mexico has one of the highest rates of child poverty, at 21%. But when measuring the impact of income support programs and tax credits using the SPM, it is clear that New Mexico’s leaders have made a different choice than many other states: the child poverty rate by this measure is 11%, a nearly 50% reduction in the poverty rate when accounting for policies that make a difference for large numbers of children in the state (see Figure 2).
One analysis found that in New Mexico, the federal Earned Income Tax Credit lifts 15,000 children out of poverty, while SNAP is responsible for moving 13,000 children out of poverty, showing the significant impact these anti-poverty programs have in New Mexico communities.
Notably, the new data released do not reflect the impact of declining SNAP enrollment happening now as a result of the passage of the One Big Beautiful Bill Act in 2025. But already, New Mexico has seen nearly 13,000 fewer children enrolled in SNAP despite families facing greater economic strain, a dramatic drop that is likely to be reflected in the state SPM of child poverty in the coming years.
New Mexico’s leaders can continue to make state tax policy more fair and keep working to ensure the maximum number of households with children in the state are able to keep the income support program benefits that prevent more children from experiencing poverty. Poverty is a policy choice, and at the federal level, policy choices are already starting to cause harm to our communities. New Mexico should continue to build on the foundation of better policy choices our leaders have made to give our children more opportunities to thrive.