Who it would help, how much they would benefit, and why indexing it to inflation is necessary
Download this report (Sept. 2015; 12 pages; pdf)
by Gerry Bradley, MA
Raising the minimum wage is an important and effective strategy for reducing poverty particularly given the erosion of the purchasing power of the state wage since it was last raised in 2009. In New Mexico, approximately 112,000 workers are earning the current state minimum wage of $7.50. In January, New Mexico lawmakers should act to raise the minimum wage to $10 per hour by 2018. While this increase should not be considered a living wage, thousands of families would benefit.
There will probably be a proposal to raise the state’s minimum wage to $10 an hour in the 2016 legislative session. That would be the first minimum wage increase for the whole state since the present minimum wage of $7.50 took effect in January of 2009. This report assumes an increase in two steps, to $8.50 an hour in 2017 and to $10 an hour in 2018. In 2018, according to the Economic Policy Institute (EPI), there will be about 771,000 workers statewide making an hourly wage in New Mexico. The EPI estimates that 112,000 workers would be directly helped by raising the minimum wage to $10 an hour. An additional 79,000 workers would be indirectly affected – their wages would rise due to spillover effects from raising the wage to $10. The total number of workers affected would be 191,000 or almost 25 percent of hourly workers. This report describes the characteristics of these low-wage workers and looks at the EPI’s estimates of the wage impacts of raising the state’s minimum wage.
Summary of the Impact of Increasing the Minimum Wage to $10
Table I-a summarizes the impact that raising the minimum wage to $10 will have on the New Mexico workforce. About 112,000 workers will be directly affected, meaning that these workers will see their wages rise as the new minimum wage exceeds their current pay. Indirectly affected workers have a wage rate just above the new minimum wage. Indirectly affected workers will receive a raise as employer pay scales are adjusted upward to reflect the new minimum wage.
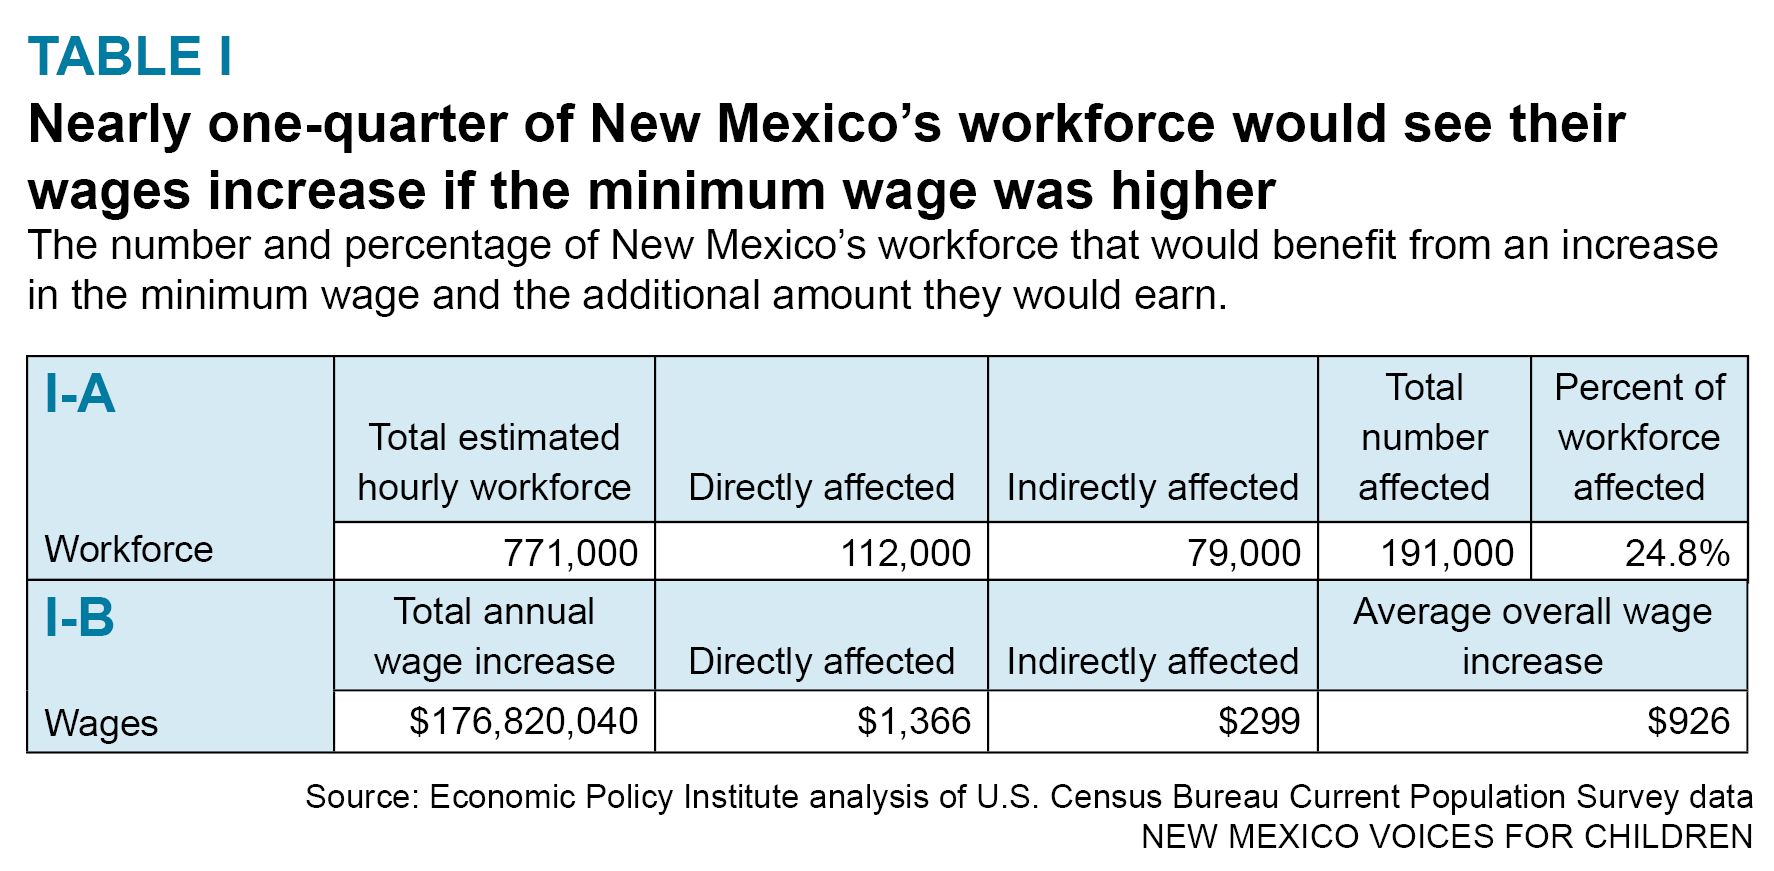
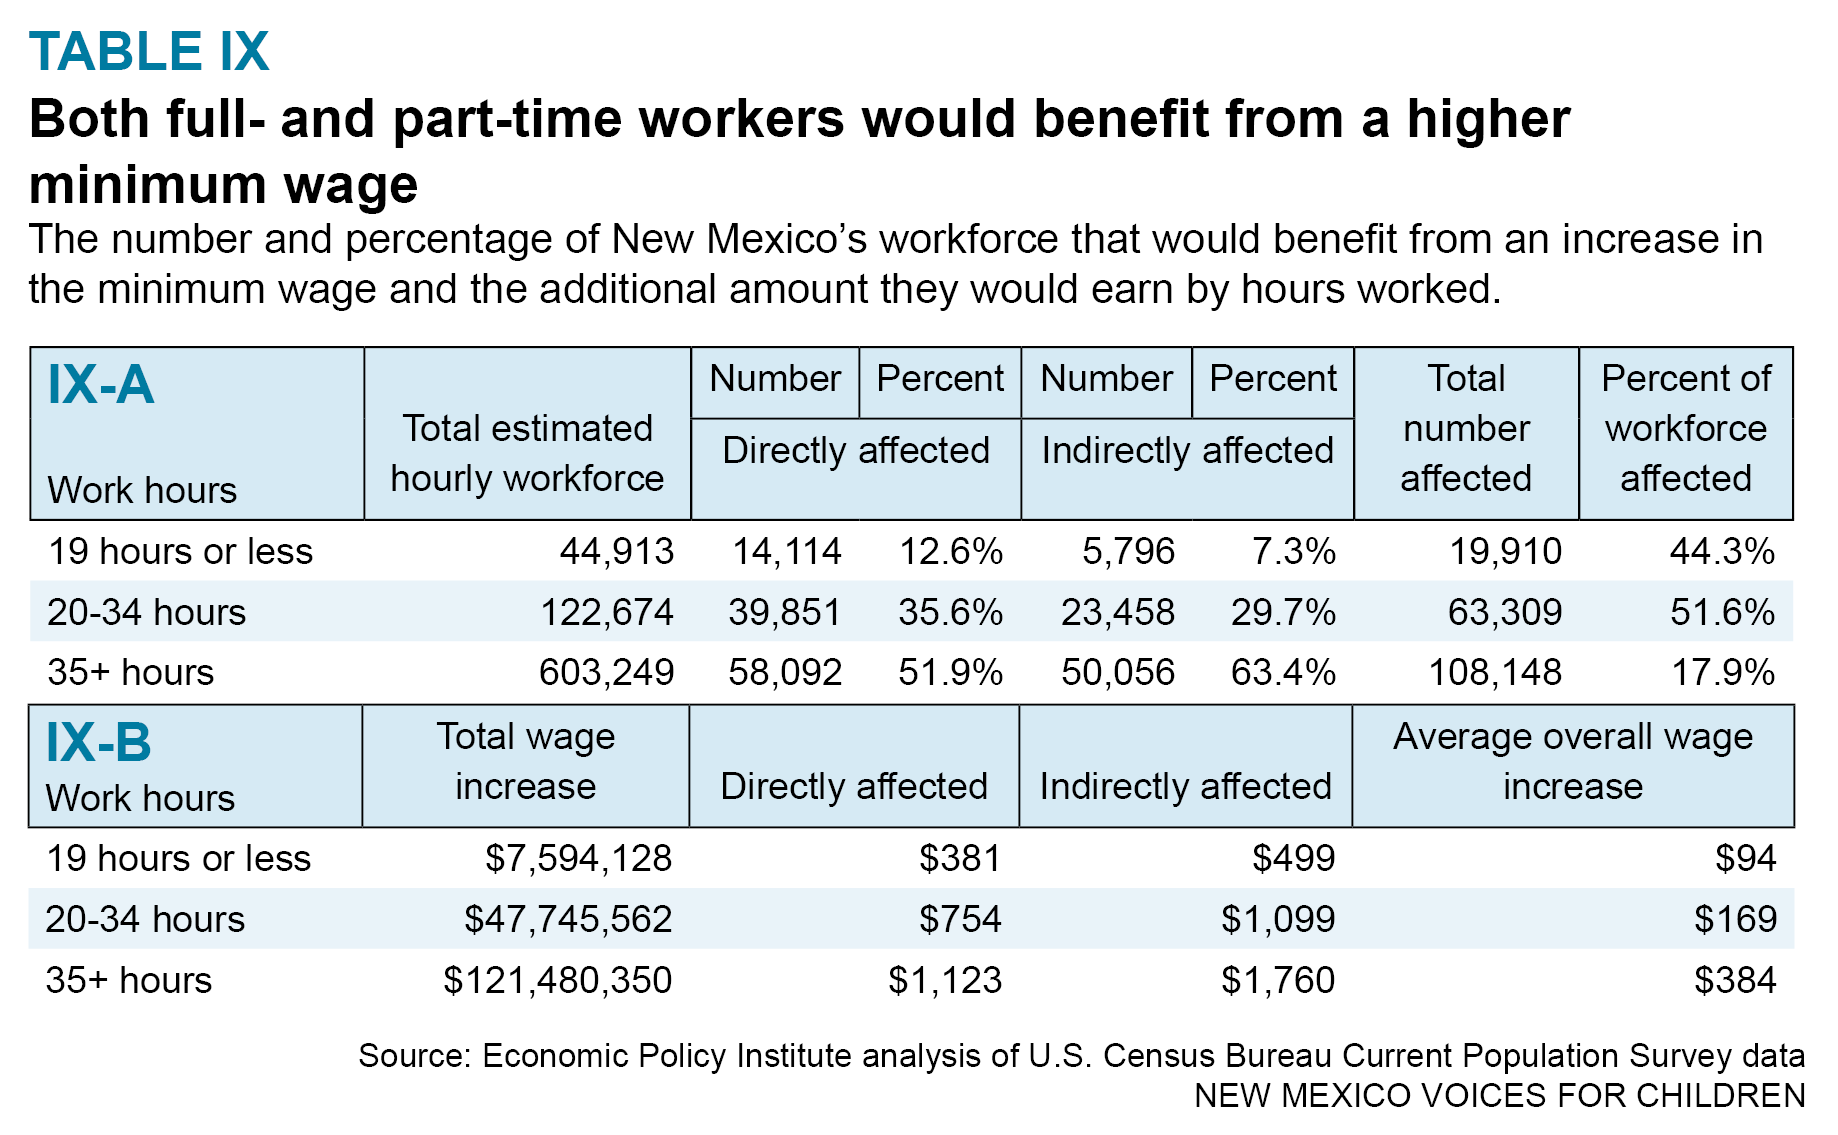
Table I-b shows that increasing the minimum wage to $10 will add a total of almost $177 million a year to the paychecks of workers at or near the minimum wage. On average, the workers affected by the increase will receive an annual wage increase of $926. Directly affected workers will receive an increase of $1,366 while indirectly affected workers will receive an annual increase of $300. There will be also positive impacts on the state’s gross domestic product and a slight increase in total employment.
Children in Families with Minimum Wage Workers
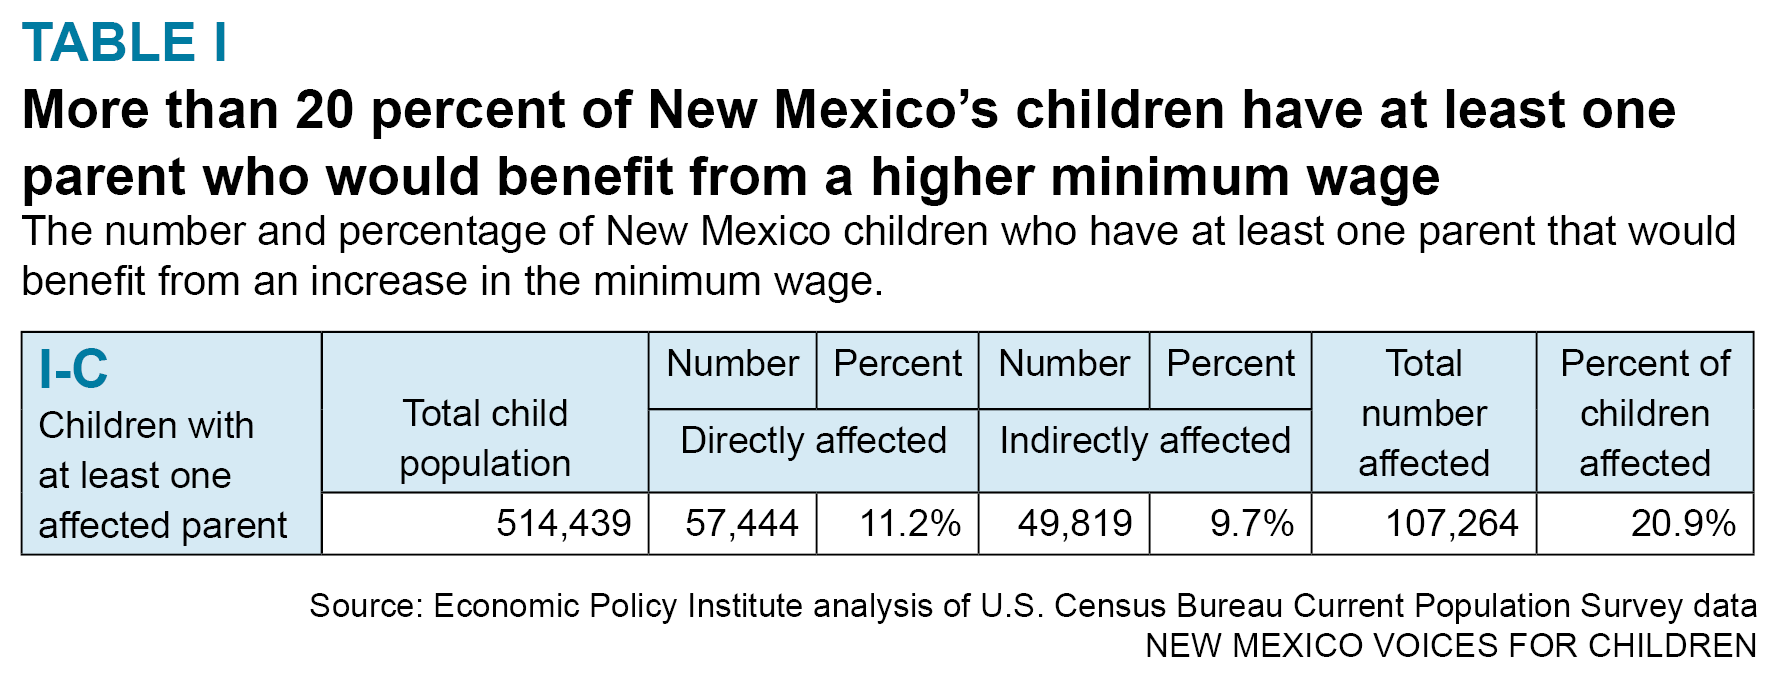
Table I-c shows that there are about 57,400 children living in families with low-wage workers. This is slightly more than one-tenth of all children in New Mexico. Altogether, there are 107,300 children living in households with directly and indirectly affected workers, or 21 percent of all children in New Mexico. Clearly, low-wage work affects a significant share of New Mexico’s children. Also, the prevalence of low-wage work in New Mexico probably inhibits household formation, marriage, and having children because minimum wage workers don’t have the financial resources to do so.
Impact of the Increase on Women and Men
More women workers than men will benefit by raising the state minimum wage. Table II-a shows that about 61,000 women and 51,000 men would directly benefit from the higher minimum wage. About 30 percent of all women workers and 21 percent of all male hourly workers would be impacted by the increase. This is despite the fact that there are more male (407,400) than female (363,400) hourly workers.
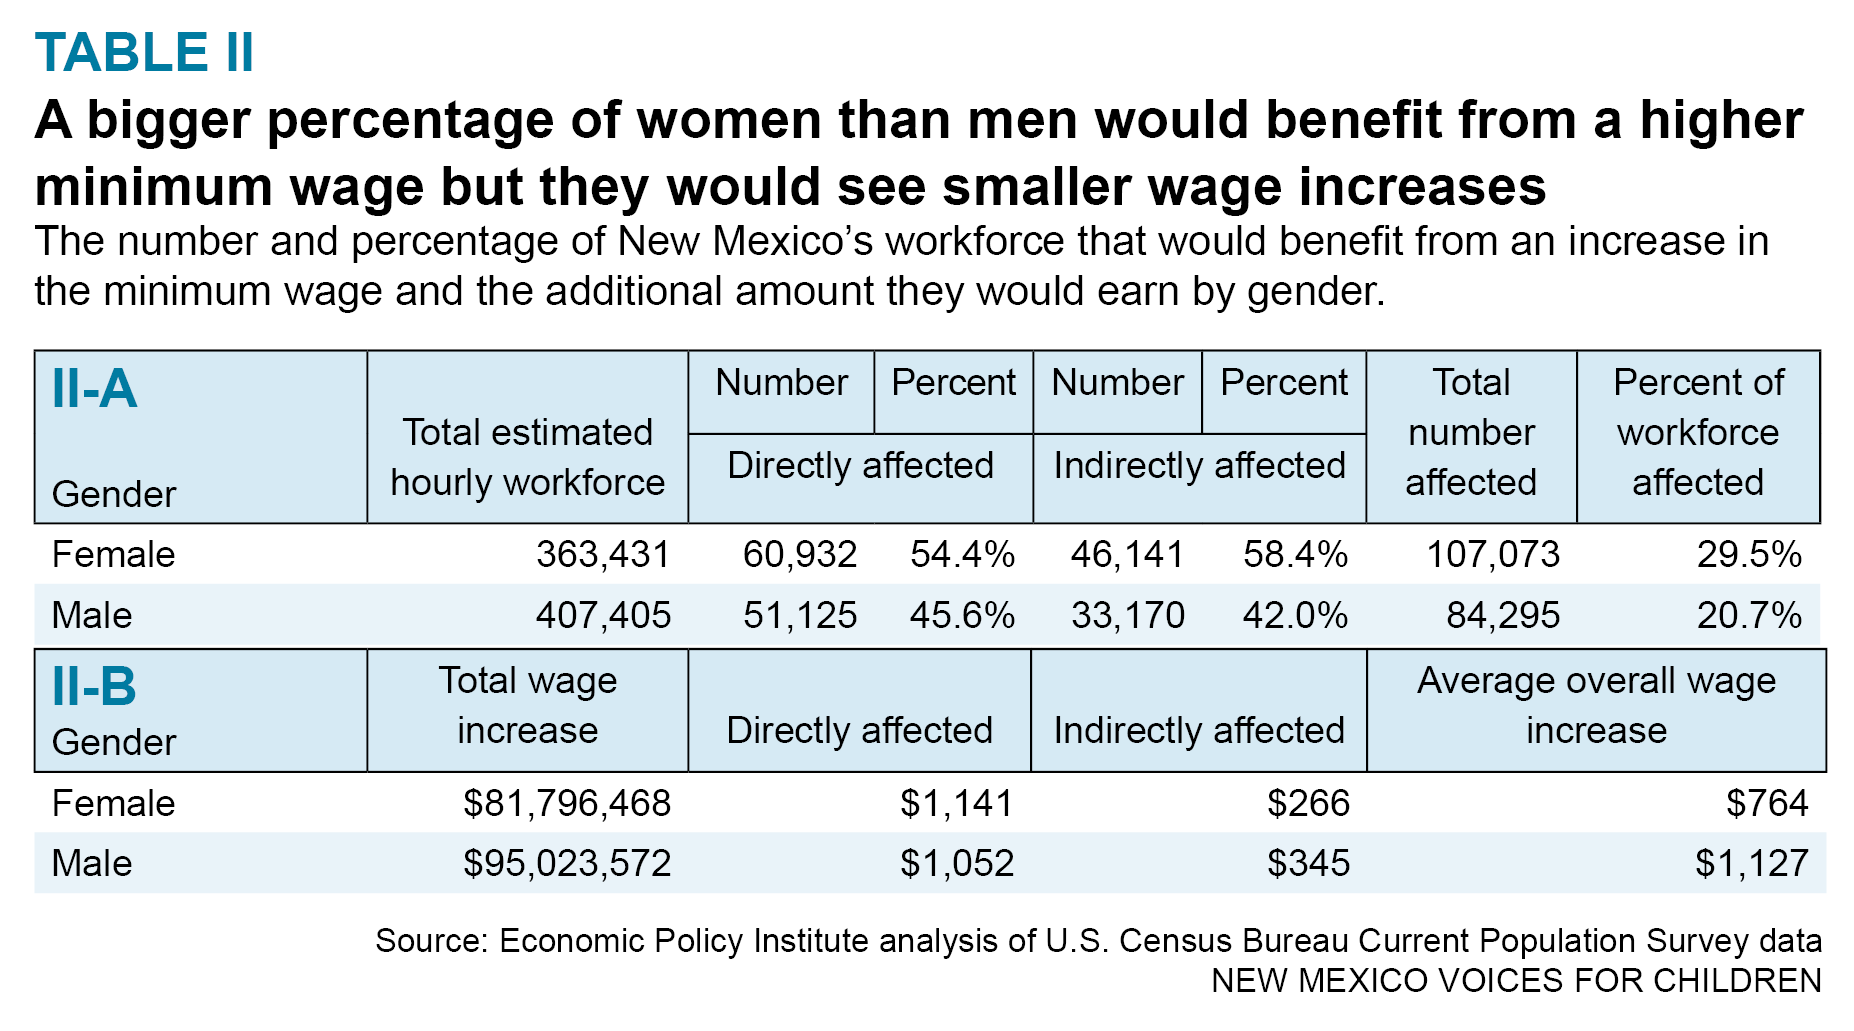
Despite these odds, men will receive a larger annual wage increase than women, as Table II-b shows. While men will earn $1,127 more, on average, women will earn just $764 more. This reflects the different mix of industries and occupations in which men and women work, as well as the fact that the average wage increase for male workers who are indirectly affected is higher than for female workers in that position.
Impact by Age
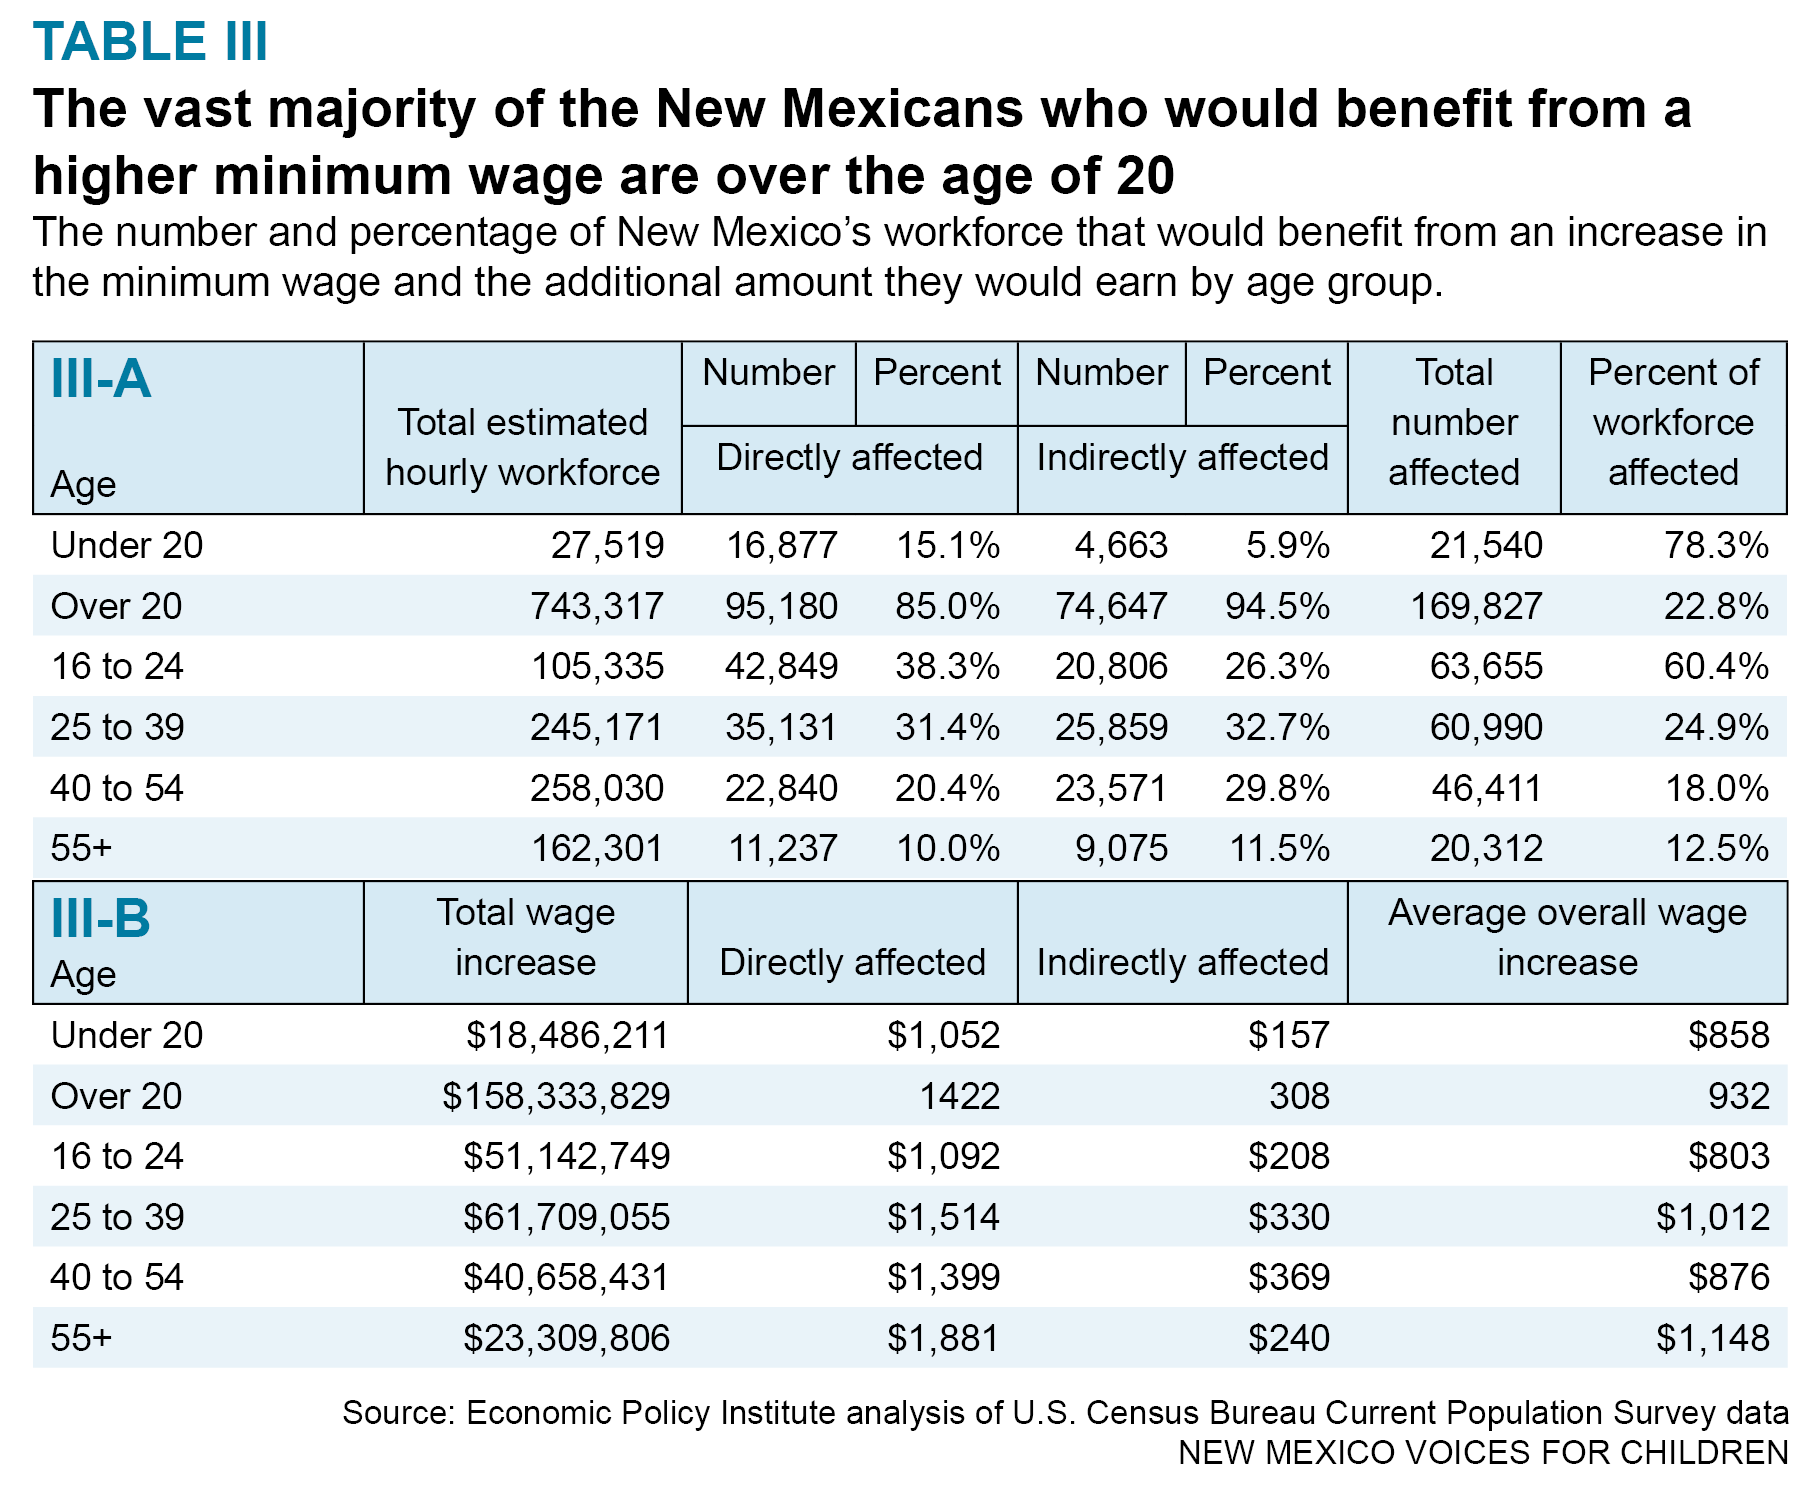
Most of the workers who will be helped by raising the minimum wage are not teenagers, but adult workers. An erroneous, but common, perception about minimum wage workers is that they are by and large teenagers. Table III-a shows that, of the total 112,000 workers directly impacted by the minimum wage increase, only about 17,000 or 15 percent are teenagers (younger than 20 years old). About 62 percent of the affected workers (70,000) are age 25 and older, with 30 percent over age 40. Even more telling, a significant proportion, 10 percent, are seniors, workers older than 55. One might visualize a greeter in a big box superstore, a senior working to make ends meet.
Impact by Ethnicity
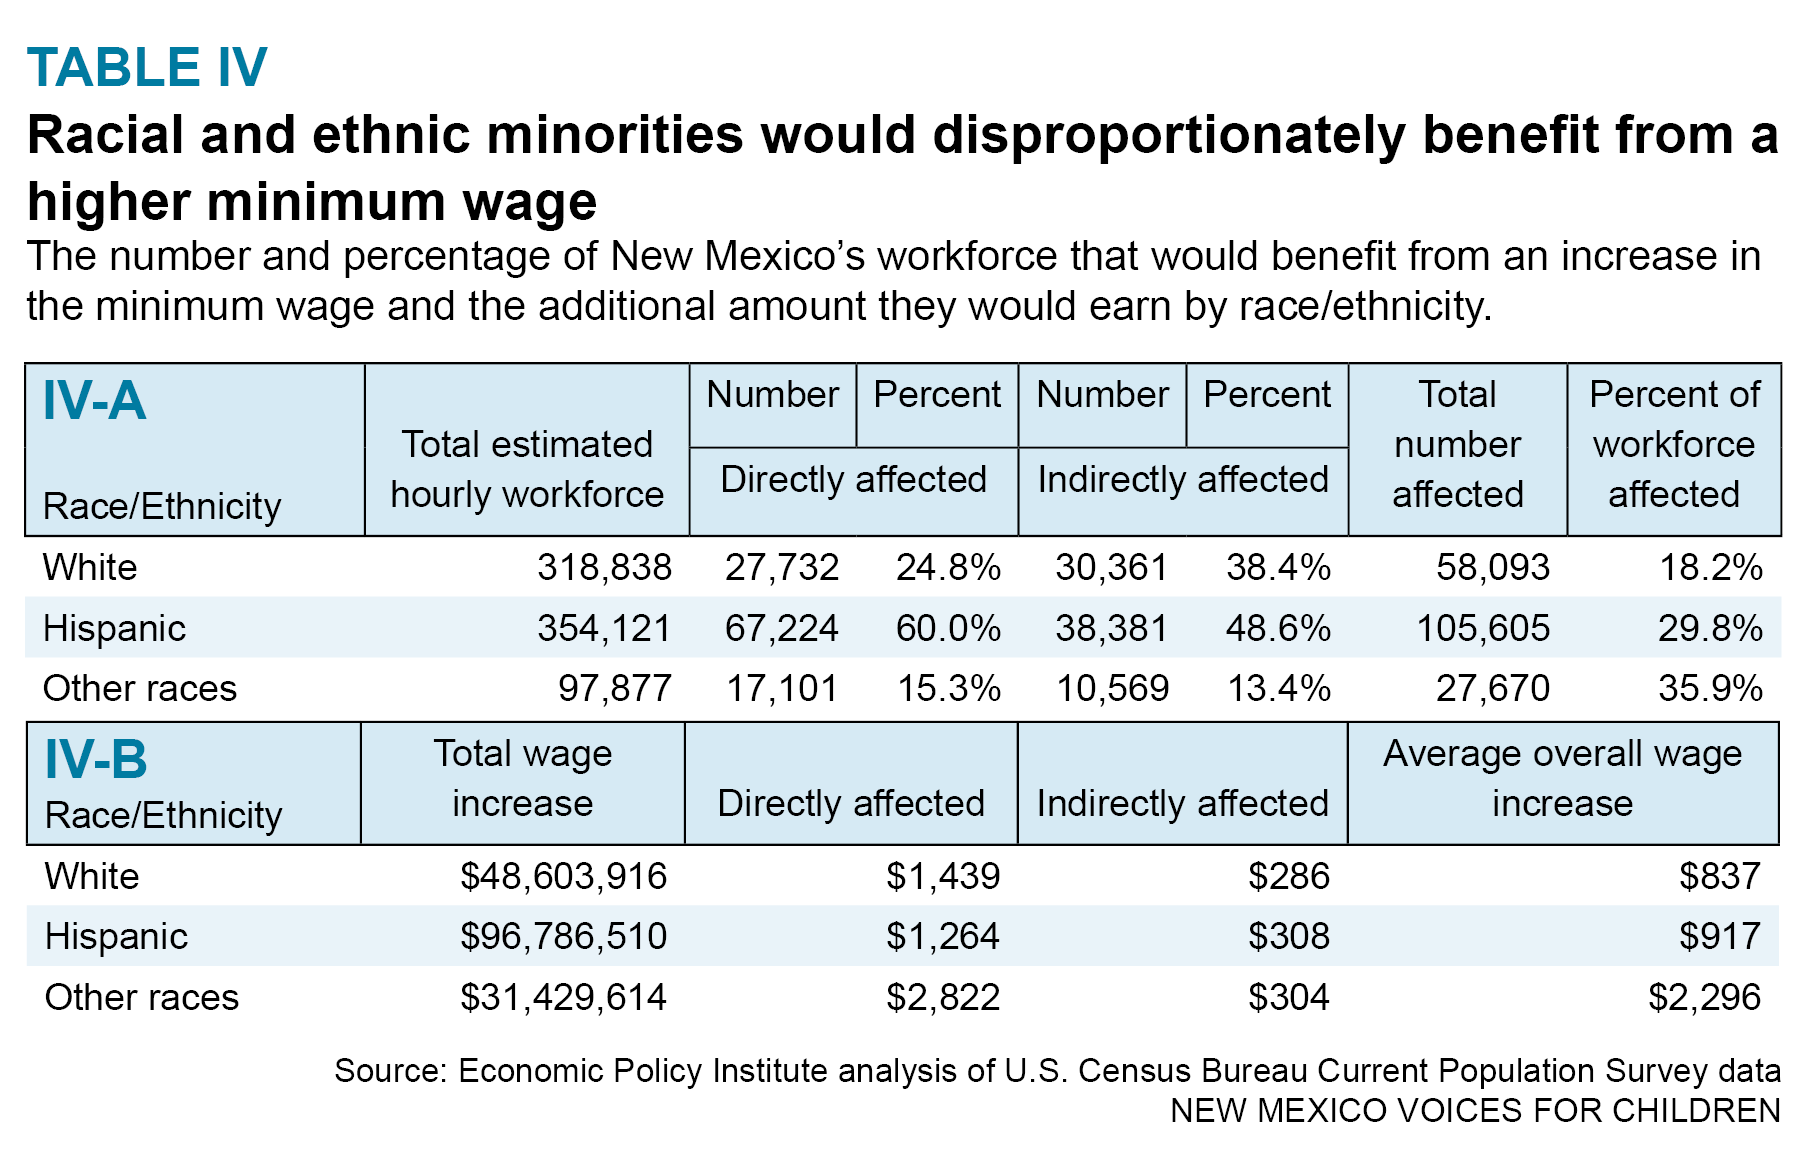
Table IV-a shows the distribution of workers helped by the minimum wage increase by ethnicity. Hispanic workers are by far the largest share of those helped by the minimum wage increase because they are disproportionately represented in low-wage jobs. Although Hispanics are about 46 percent of hourly workers, they make up 60 percent of those who are earning the minimum wage. Although 41 percent of hourly workers are Non-Hispanic White, they make up just 25 percent of those helped by the minimum wage increase.
Impact by Marital and Family Status
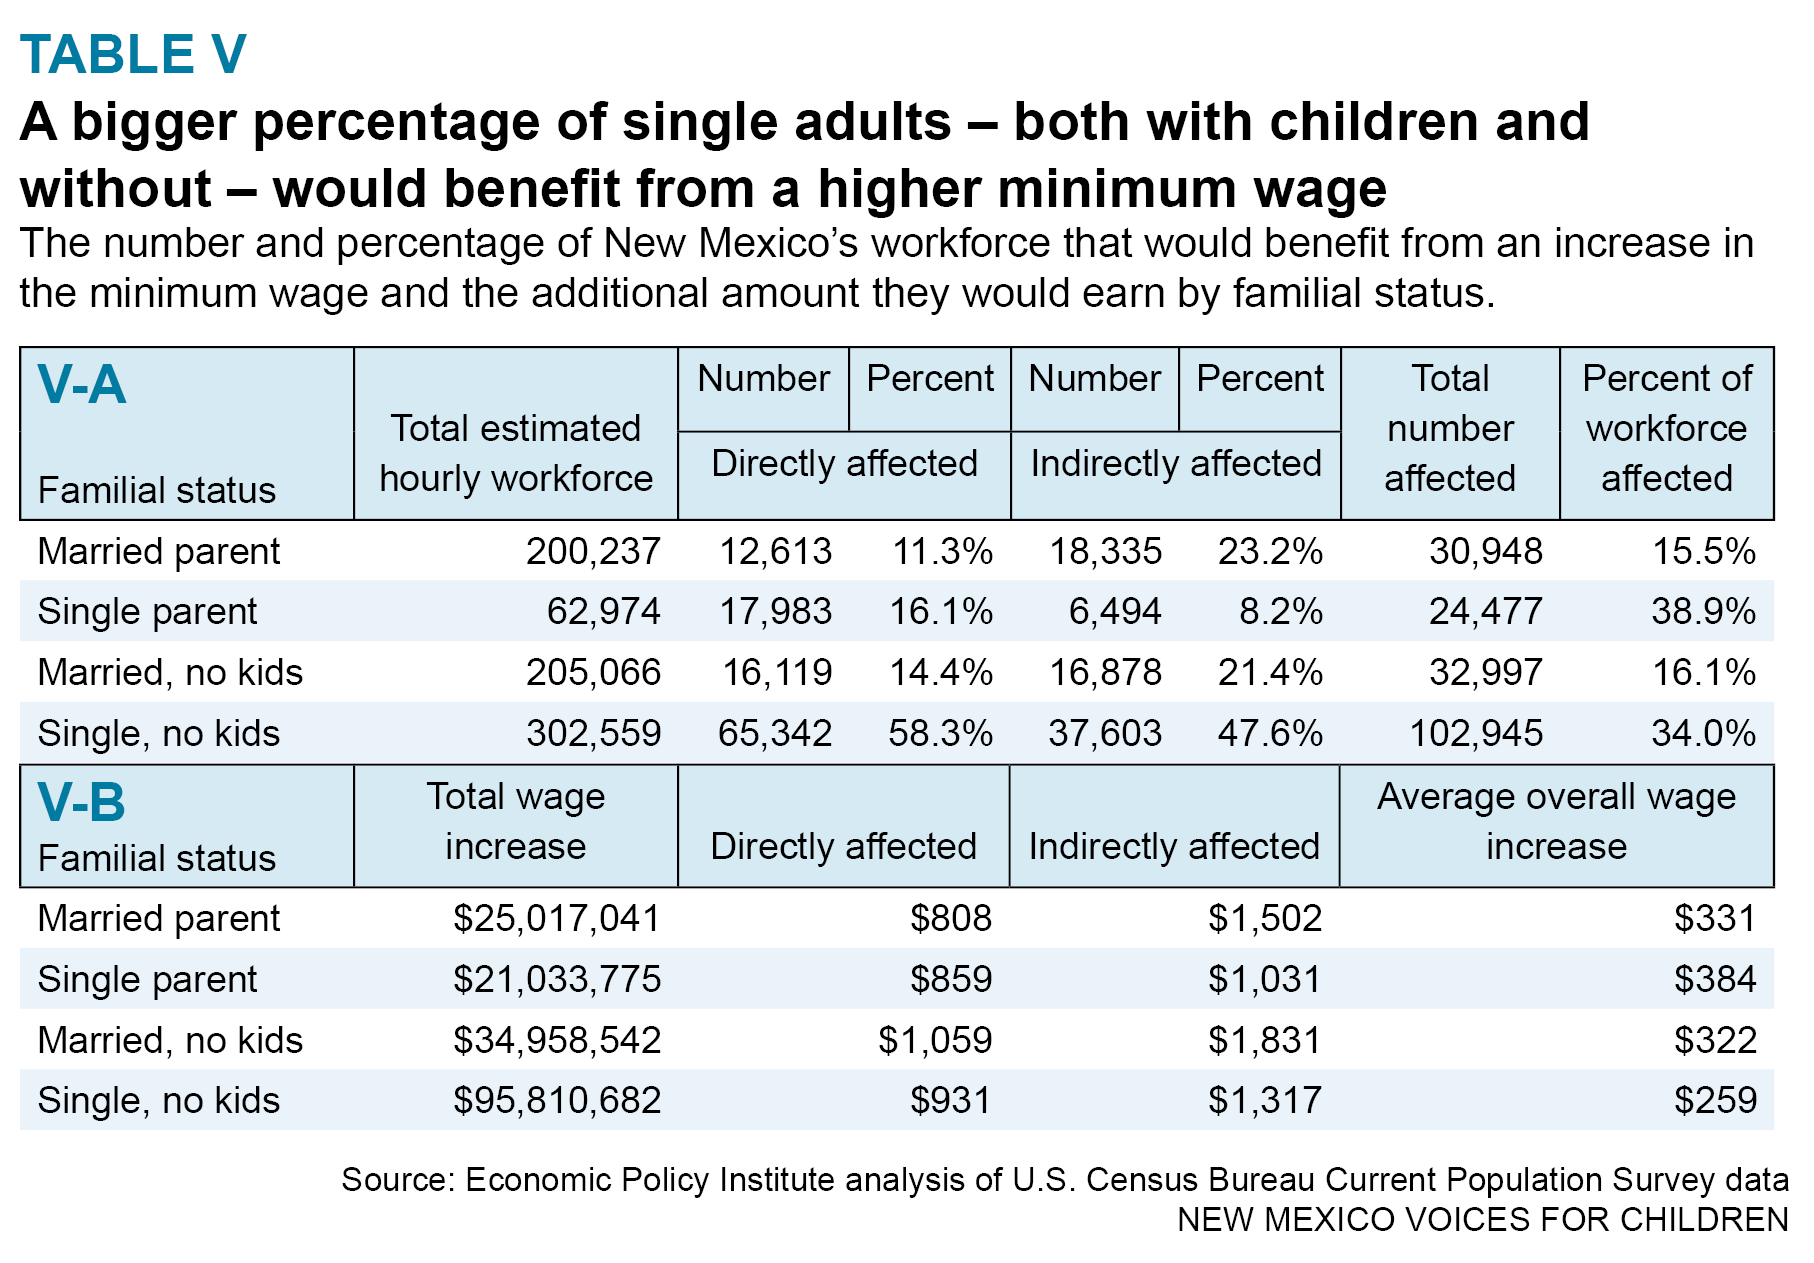
Table V-a shows the distribution of those helped by a minimum wage increase by marital status. Almost 60 percent of affected workers are unmarried, with no children. This may be because low-wage workers are not able to afford to marry and have children. A significant share of low-wage workers are married, but have no children (14 percent). Again, this may be because these workers feel they cannot afford to have children.
Impact by Family Income Level
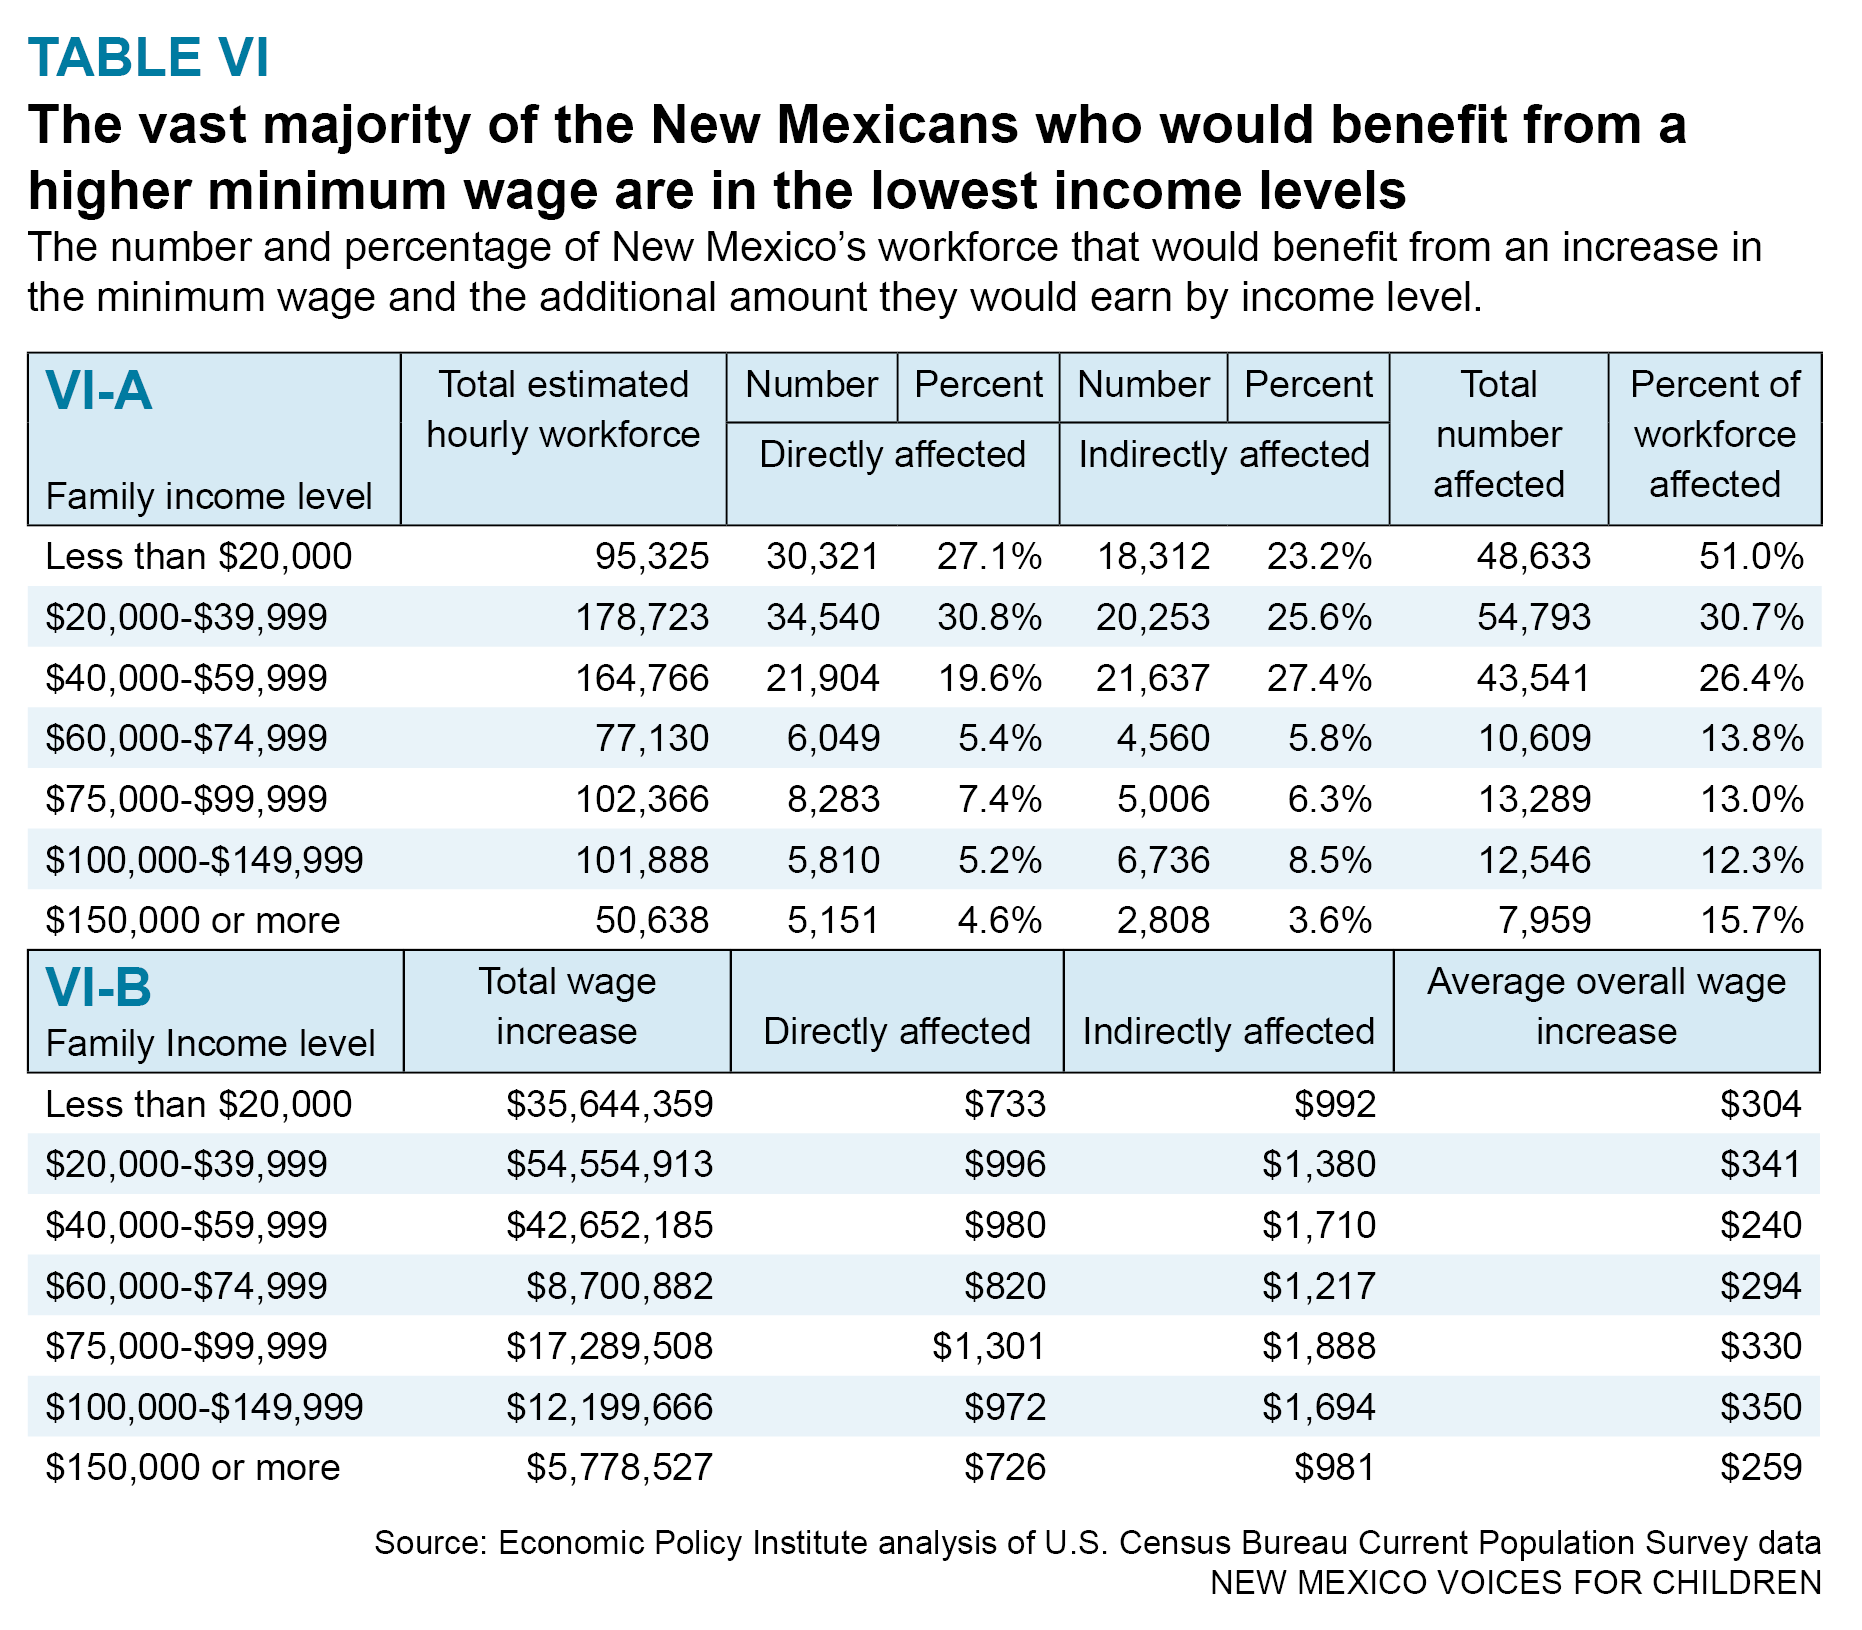
Another popular misconception about minimum wage workers is that they live in upper-income families and are merely teenagers working for entertainment income. This is clearly not the case. By and large, workers impacted by raising the minimum wage are living in low-income families. Table VI-a shows that a little more than one-quarter of workers benefiting from the minimum wage increase live in families with a family income less than $20,000 per year. Another 30 percent of low-wage workers live in families with income between $20,000 and $40,000, so almost 60 percent of workers directly impacted by the minimum wage increase are in families with income less than $40,000.

Impact by Industry Sector
Table VII-a provides an overview of low-wage workers by type of industry. As expected, the retail (22 percent) and leisure and hospitality (24.4 percent) sectors together account for a significant share (46 percent) of low-wage workers. It is somewhat surprising to note that the education and health care sector accounts for 24,000 workers (or 21 percent) of directly affected workers. Clearly, a significant share of workers in the health care field, the fastest growing sector in New Mexico’s slowly growing economy, are low-wage workers.
Impact by Occupation of Worker
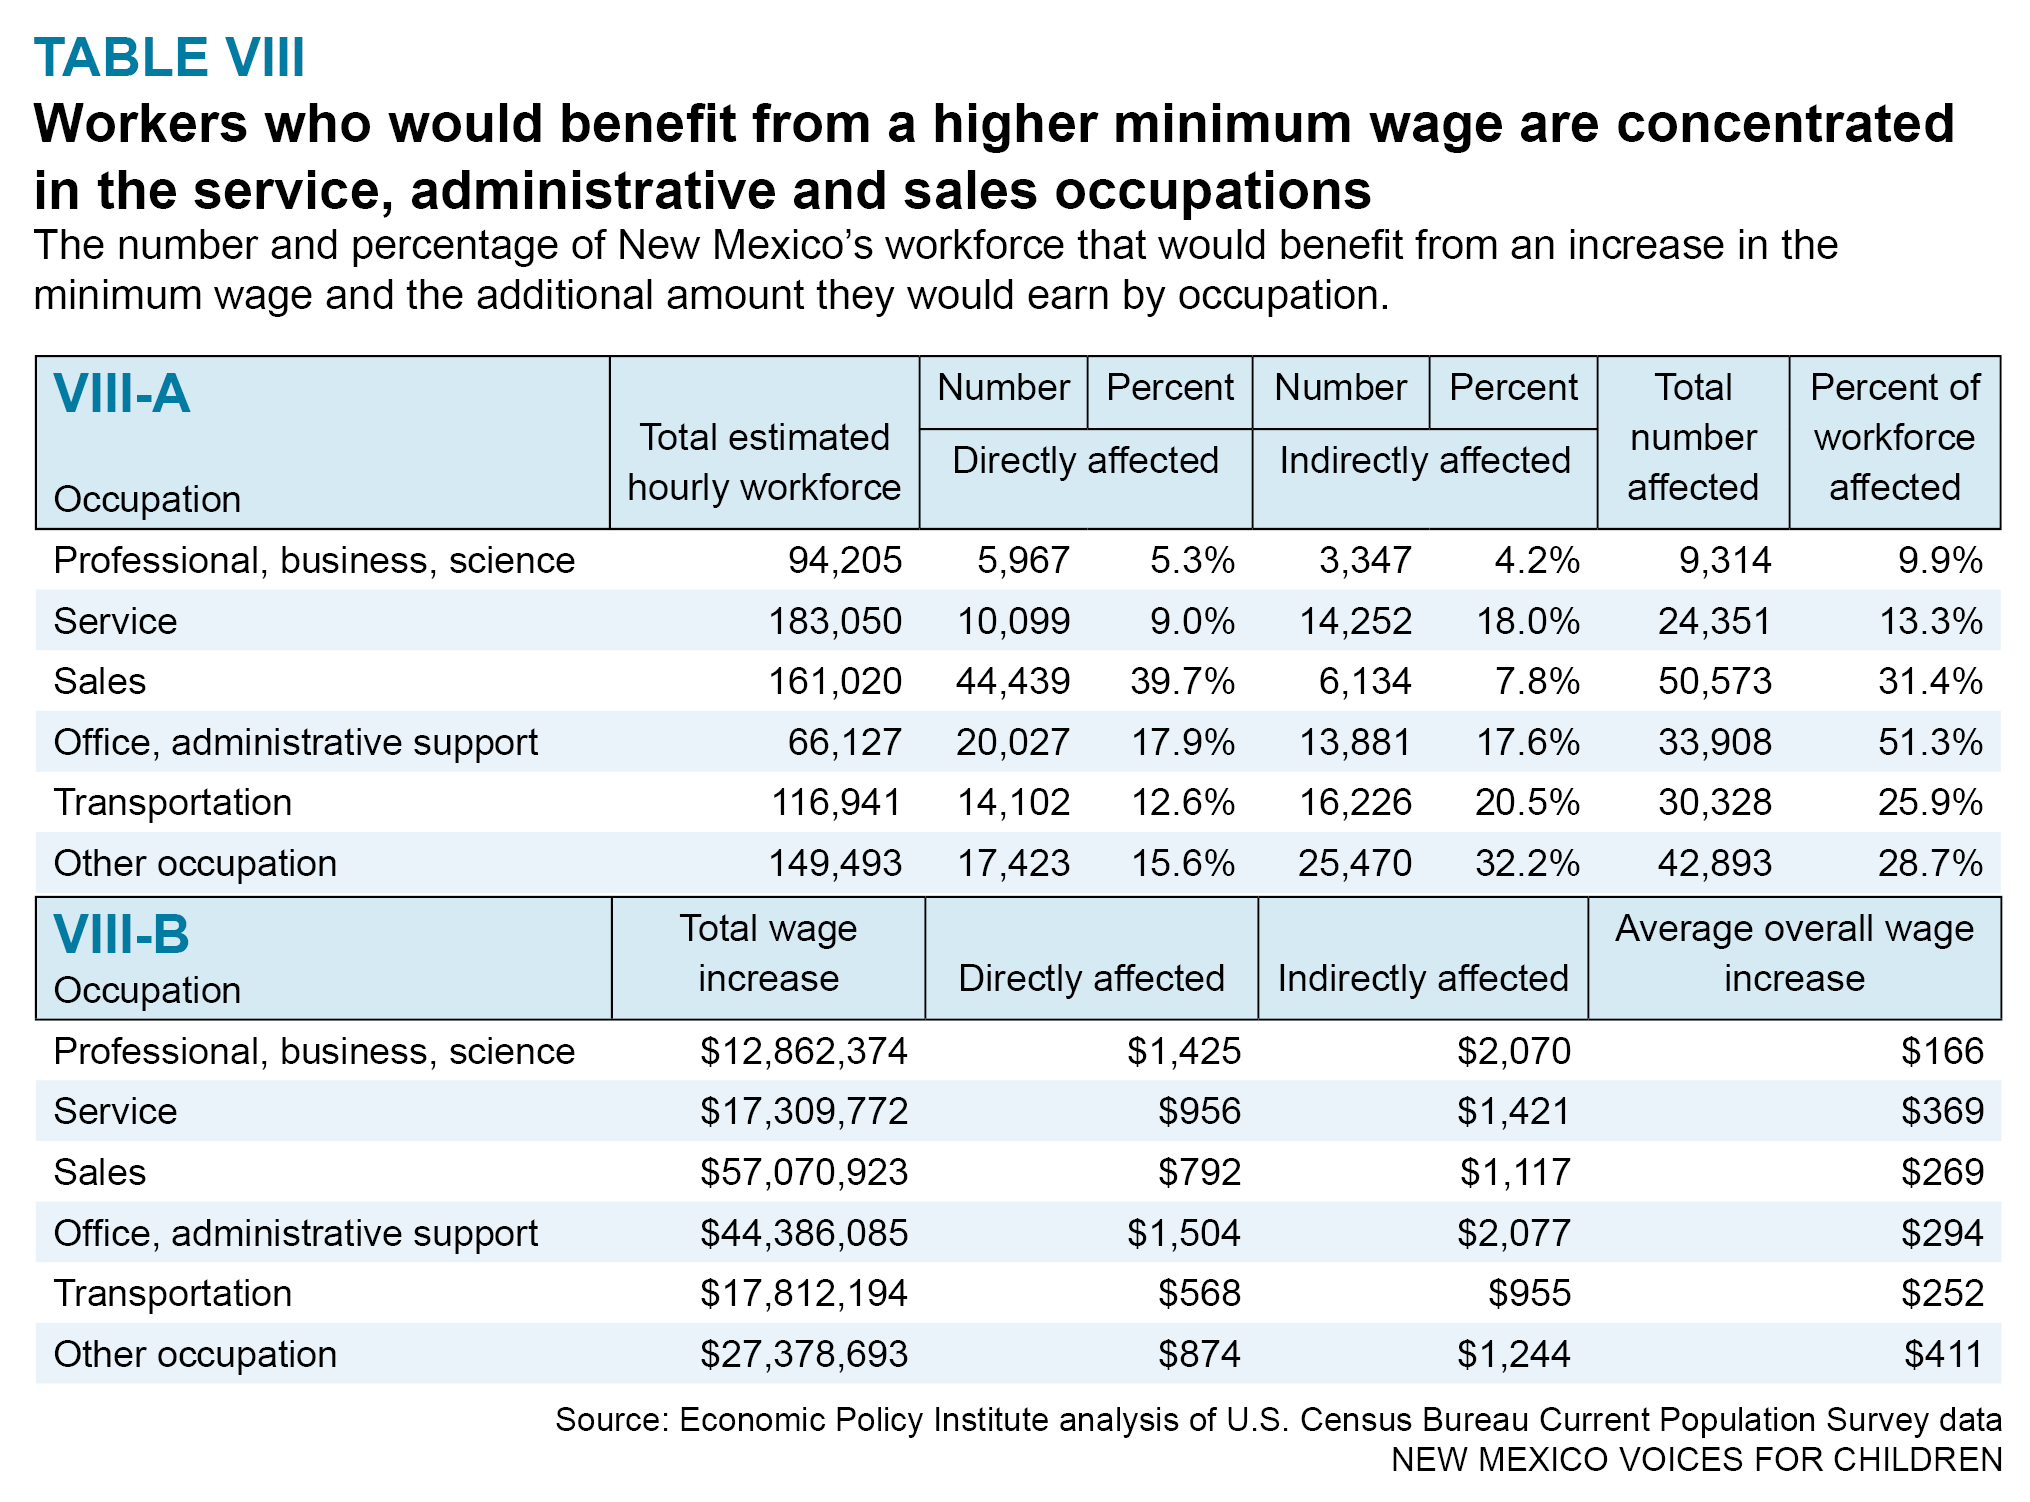
Table VIII-a shows the distribution of low-wage workers by occupation. Workers in the service (24,000) and sales (50,600) occupations account for 40 percent of the total (191,400). This is consistent with the large share of such service occupation workers in the health care industry. Workers in sales occupations account for 9 percent of directly impacted workers. It is surprising that there are 6,000 minimum wage workers in the professional, business and science occupations, reflecting the seepage of part-time and contingent work into the occupational structure.>
Impact by Hours Worked
Another hardy myth about minimum wage workers is that they are mostly part-time workers. Table IX-a shows that only one-eighth of directly impacted workers work less than 19 hours per week. Almost 40,000 minimum wage workers (36 percent) work between 20 and 34 hours per week, while 35,200 (52 percent) are full-time, working more than 35 hours per week. Many low-wage workers may welcome working more hours so that they don’t need to cobble together a subsistence living from more than one job. The fact that 80 percent of minimum wage workers work more than 20 hours per week is significant.
Impact by Educational Level
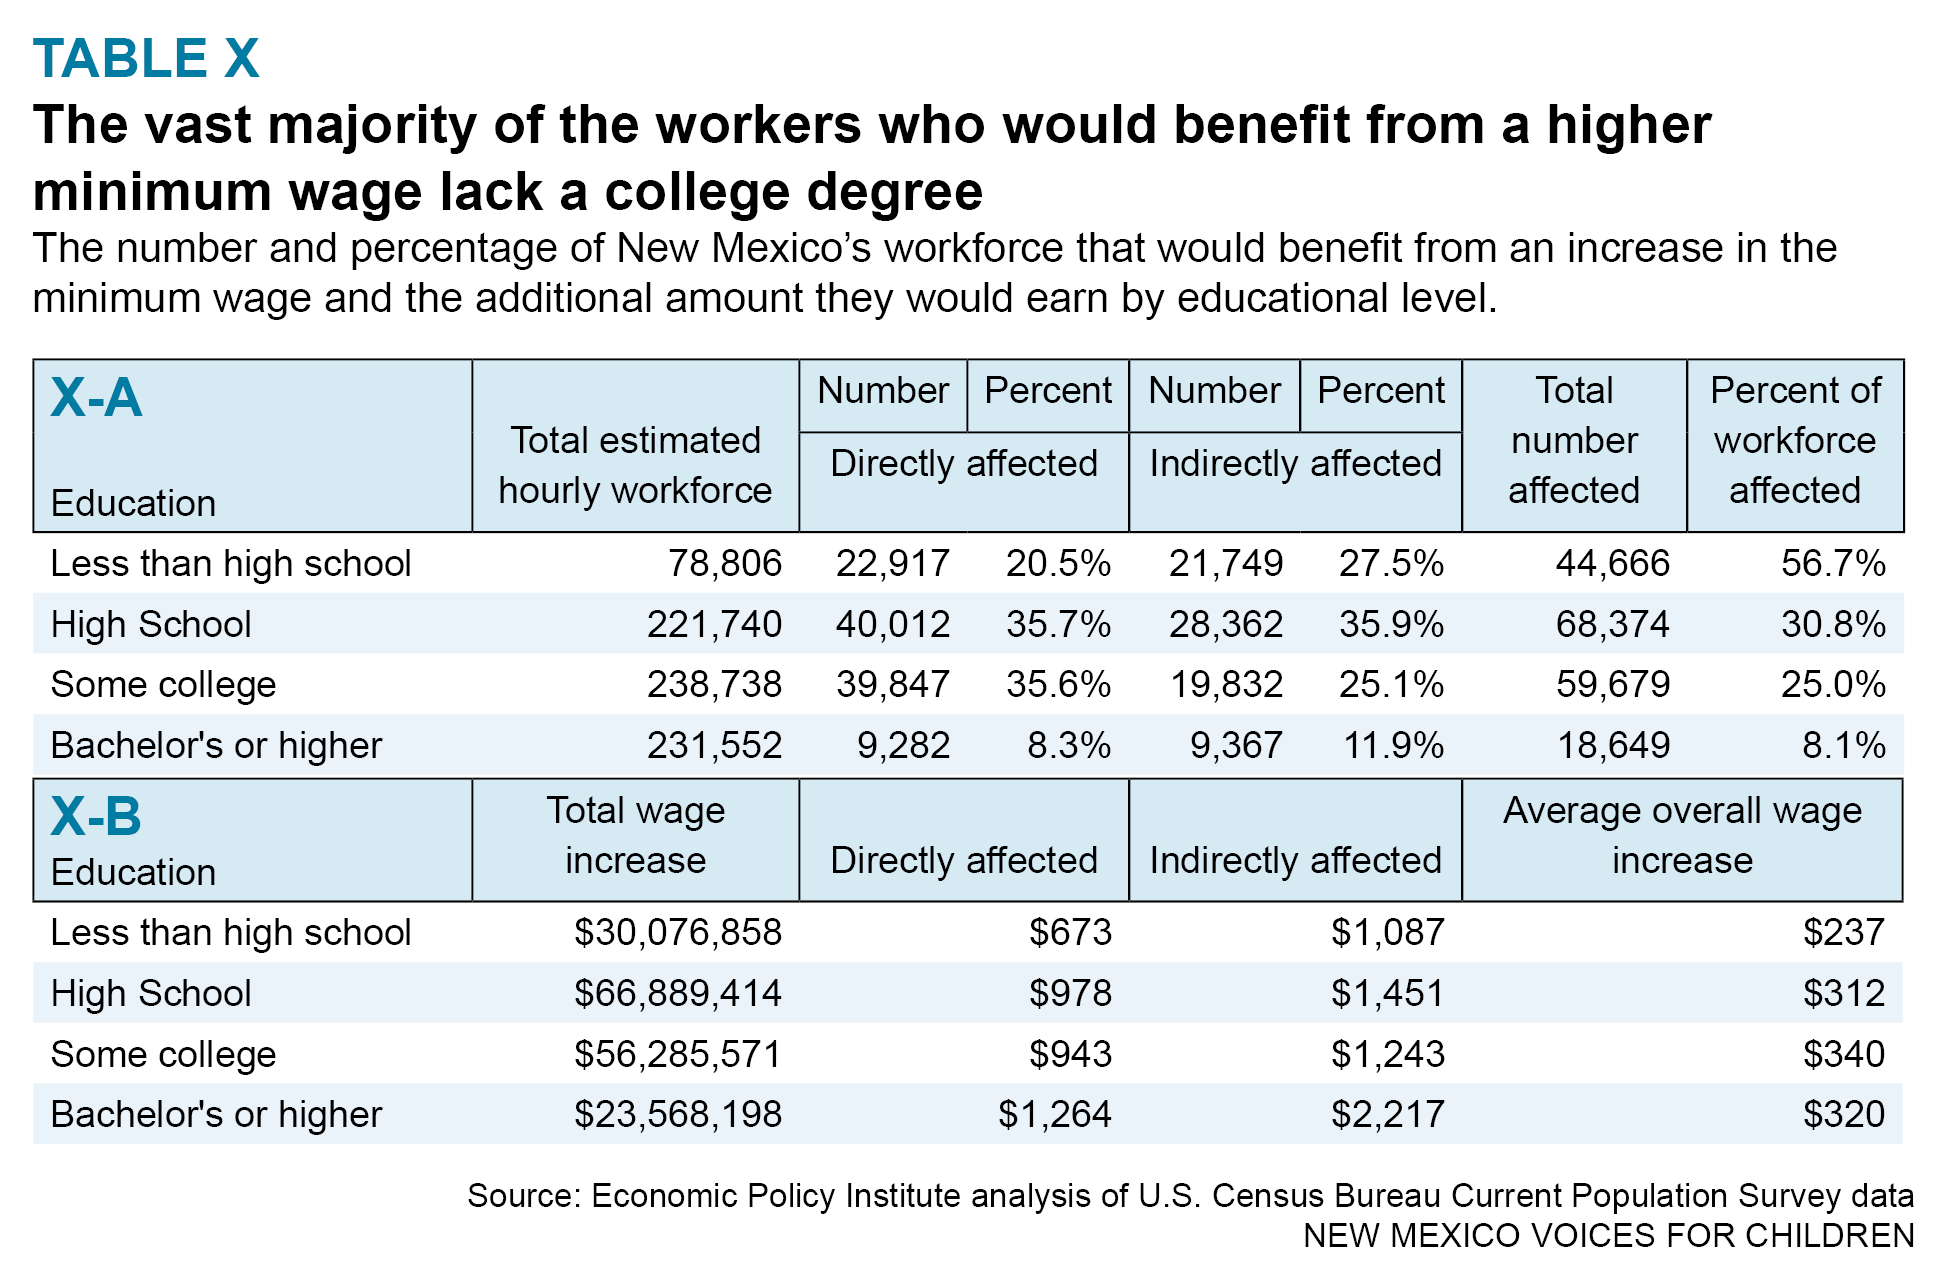
Table X-a shows that directly impacted workers are concentrated on the lower rungs of the educational ladder. Workers with less than a high school education (44,666) and those with only a high school diploma (68,374) accounted for almost 60 percent of total directly and indirectly affected workers (191,368).
Impact by Ownership of Employer
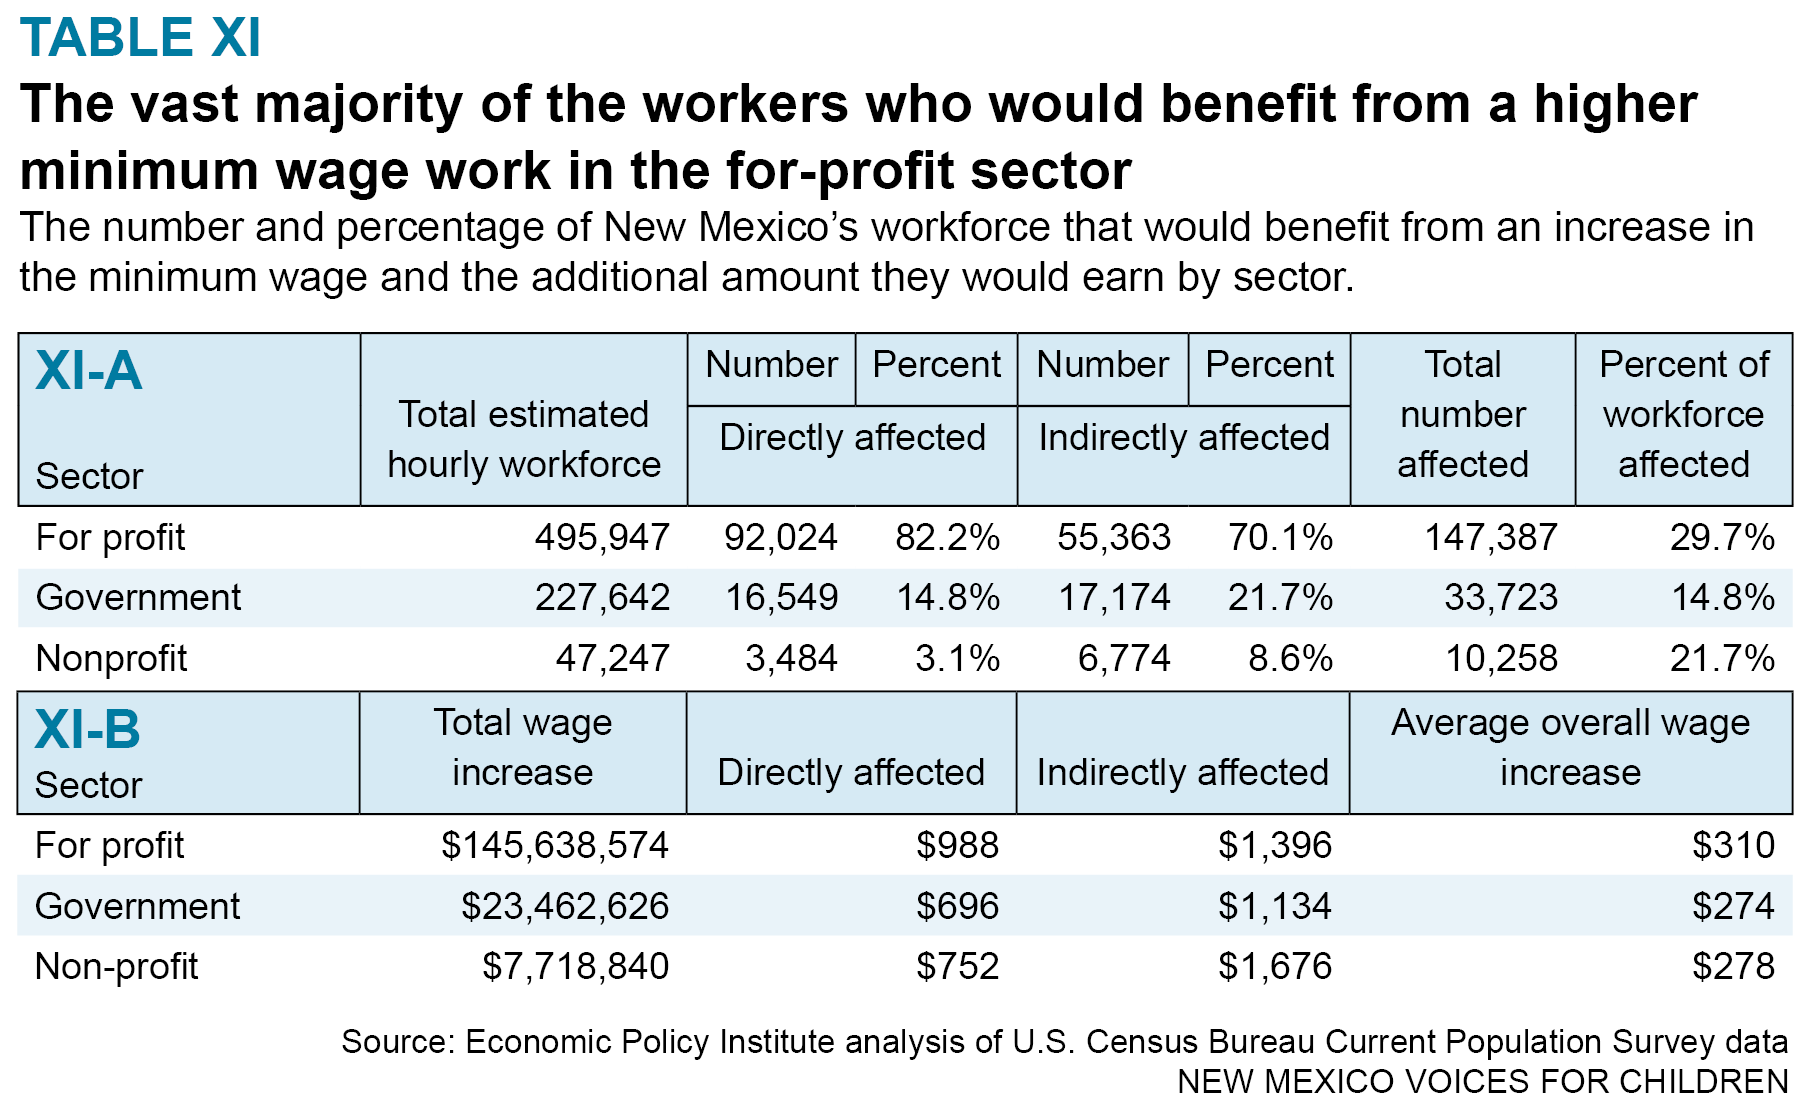
Although it is not surprising, Table XI-a shows that more than 80 percent of minimum wage workers are in the for-profit sector. It may be an eye-opener, though, that 15 percent of minimum wage workers are in the public sector. Certainly, the perception is that government workers are highly paid. By and large, that is not so when education and job tenure are taken into account.
The Necessity of Indexing the Minimum Wage to Inflation
The minimum wage was last increased in January 2009, to $7.50 an hour. That $7.50 an hour wage was not indexed to inflation and therefore its purchasing power has declined with rising prices. Chart I-a shows that the $7.50 an hour wage (shown by the blue line) has declined in value to $6.52 an hour in 2015 (the orange line), and will decline further, to $5.80 in 2020, if it is not increased.
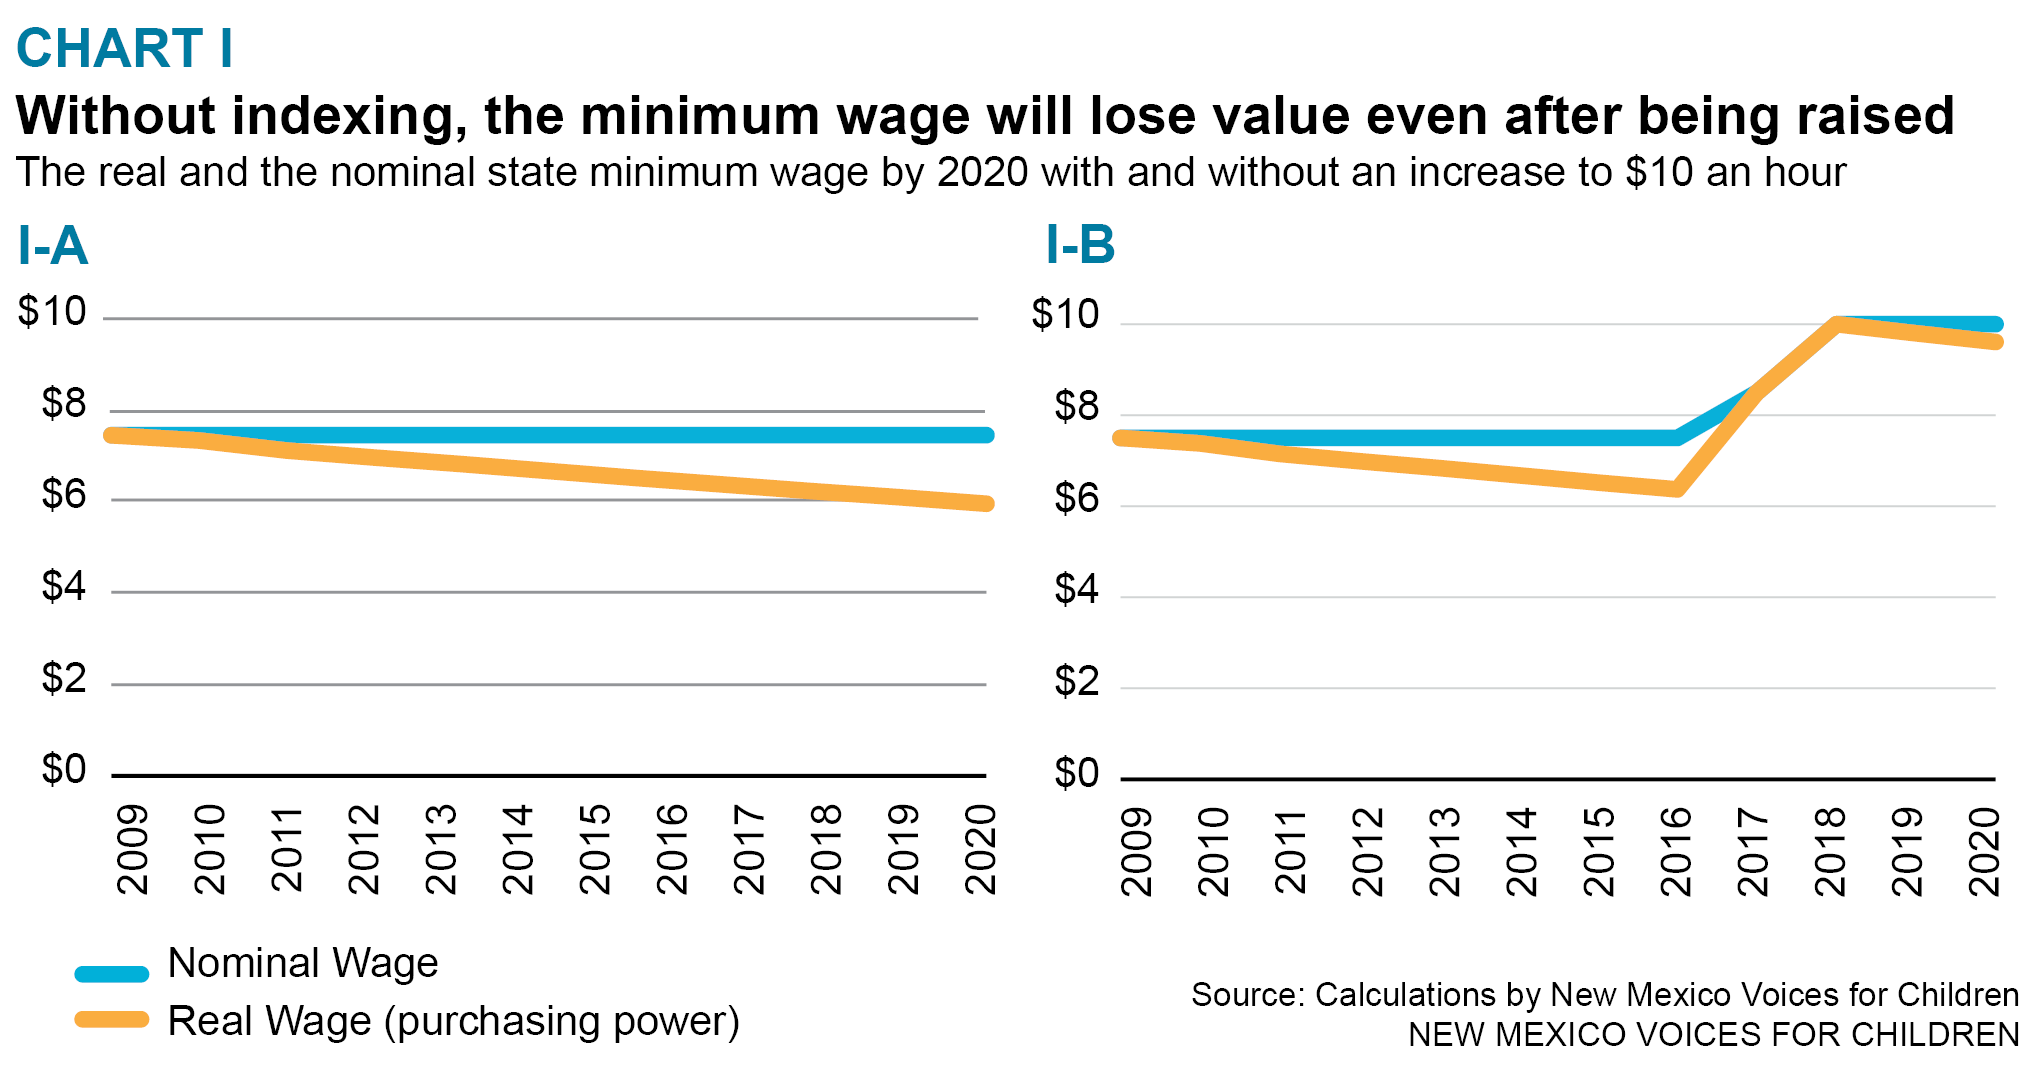
Even if the state’s minimum wage is raised from $7.50 an hour to $8.50 in 2017 and $10 at the beginning of 2018, the wage will have lost about one-tenth of its value by 2020. That is because the Consumer Price Index is expected to increase by about 2 percent for each year between 2016 and 2020. An increase in prices as measured by the Consumer Price Index means that the purchasing power of that additional dollar of income per hour will fall over time. Chart I-b shows the decline in the purchasing power of the $10 minimum wage even with inflation rising by a fairly low 2 percent per year. By 2020 the value of the $10 hourly minimum wage will have fallen to $9.05. Raising the minimum wage to $10 an hour is valuable, but not enough – the new minimum wage needs to be indexed to inflation so that it will not lose its value over time.